WorldView Jitter Plot Example for Salar de Uyuni with asp_plot#
This notebook demonstrates CSM camera analysis to compare original and optimized camera models, using example WorldView satellite data from Salar de Uyuni.
CSM Camera Model Analysis#
Compare original and optimized CSM (Community Sensor Model) camera models from bundle_adjust or jitter_solve.
Visualizes:
Position differences (X, Y, Z) along the satellite orbit
Orientation angle differences (roll, pitch, yaw)
Camera footprints on a map
Note: This example uses different test data (Salar de Uyuni, Bolivia) to demonstrate jitter correction.
import contextily as ctx
from asp_plot.csm_camera import csm_camera_summary_plot
map_crs = "32619" # UTM 19S (for Uyuni)
title = "Jitter correction (Uyuni), Less Constrained"

ctx_kwargs = {
    "crs": f"EPSG:{map_crs}",
    "source": ctx.providers.Esri.WorldImagery,
    "attribution_size": 0,
    "alpha": 0.5,
}

# First set of cameras (scene 1)
original_camera = "../../tests/test_data/jitter/uyuni/csm-104001001427B900.r100.adjusted_state.json"
optimized_camera = "../../tests/test_data/jitter/uyuni/jitter_solved_run-csm-104001001427B900.r100.adjusted_state.json"
cam1_list = [original_camera, optimized_camera]

# Second set of cameras (scene 2)
original_camera = "../../tests/test_data/jitter/uyuni/csm-1040010014761800.r100.adjusted_state.json"
optimized_camera = "../../tests/test_data/jitter/uyuni/jitter_solved_run-csm-1040010014761800.r100.adjusted_state.json"
cam2_list = [original_camera, optimized_camera]
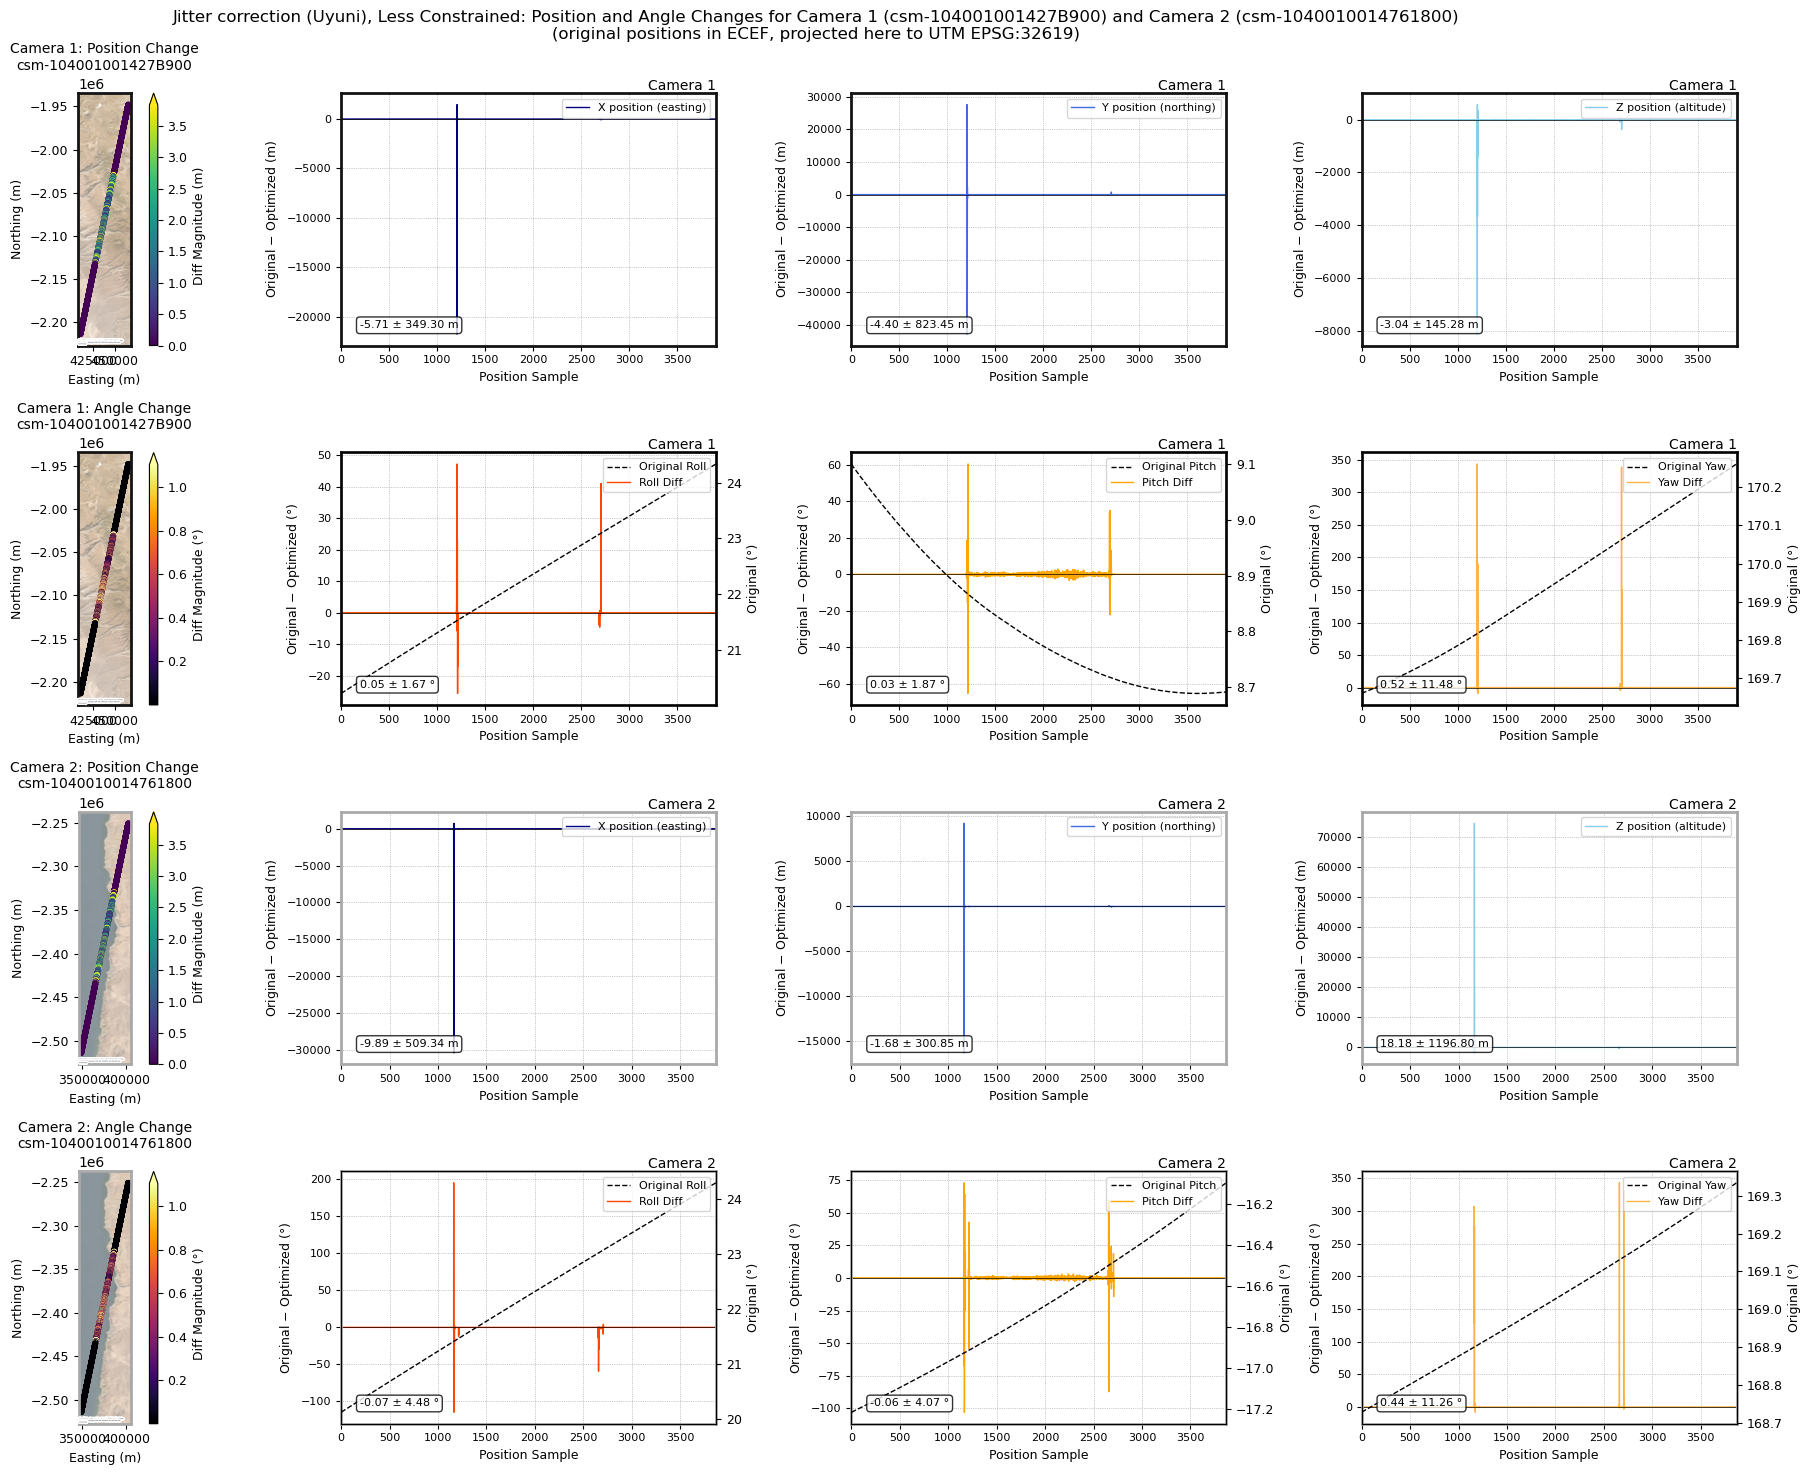
CSM Camera Comparison (Basic)#
Basic comparison without trimming or scaling.
csm_camera_summary_plot(
    cam1_list,
    cam2_list,
    map_crs=map_crs,
    title=title,
    trim=False,
    figsize=(20, 15),
    add_basemap=True,
    **ctx_kwargs
)
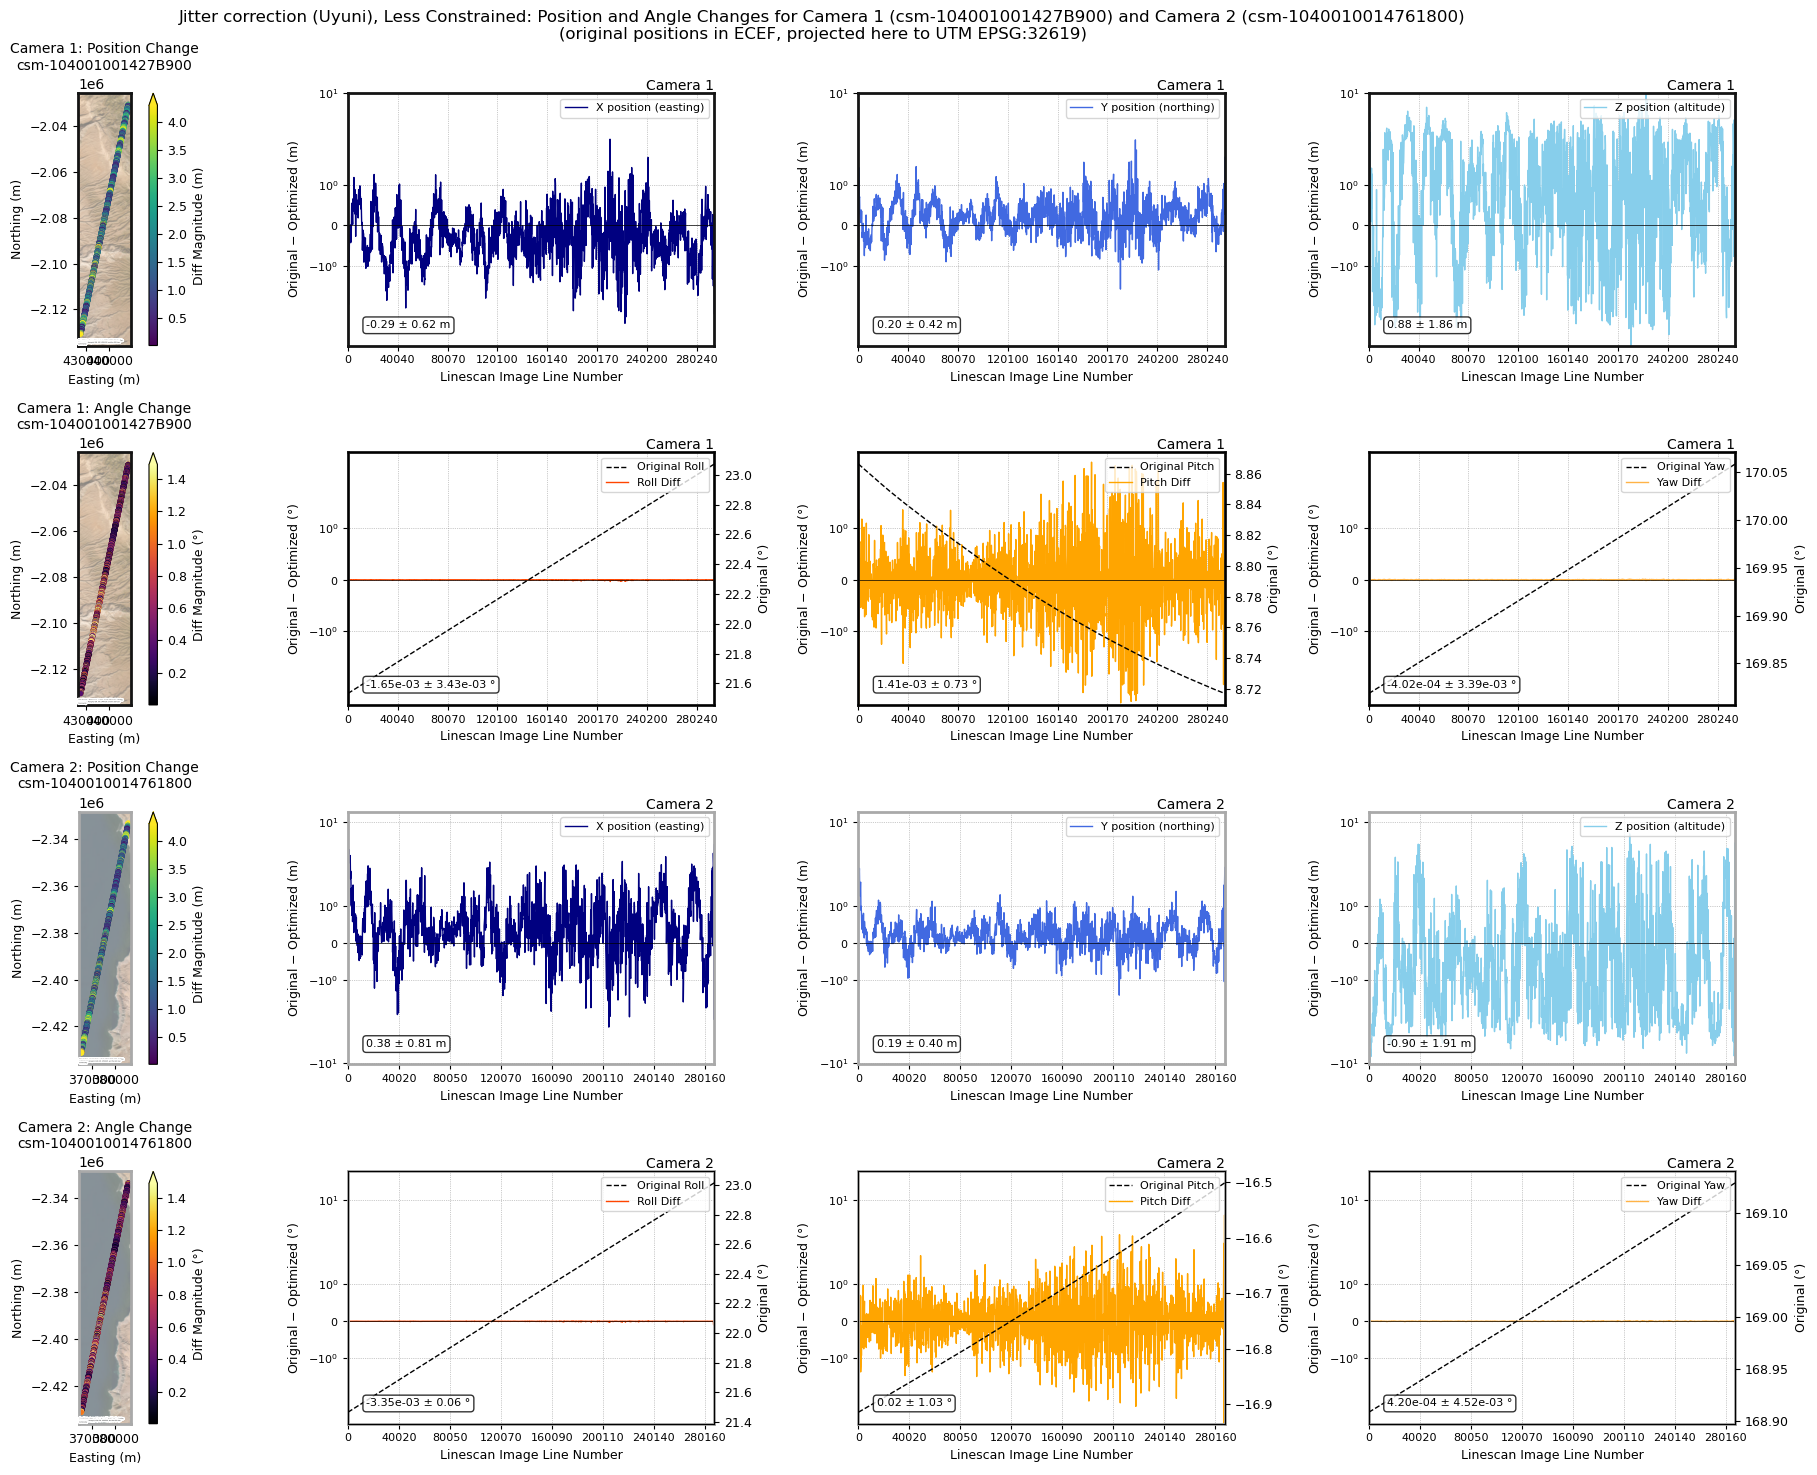
CSM Camera Comparison (Advanced)#
With trimming, log scaling, and percentile-based color limits to emphasize patterns.
csm_camera_summary_plot(
    cam1_list,
    cam2_list,
    map_crs=map_crs,
    title=title,
    trim=True,
    shared_scales=True,
    log_scale_positions=True,
    log_scale_angles=True,
    upper_magnitude_percentile=95,
    figsize=(20, 15),
    add_basemap=True,
    **ctx_kwargs
)
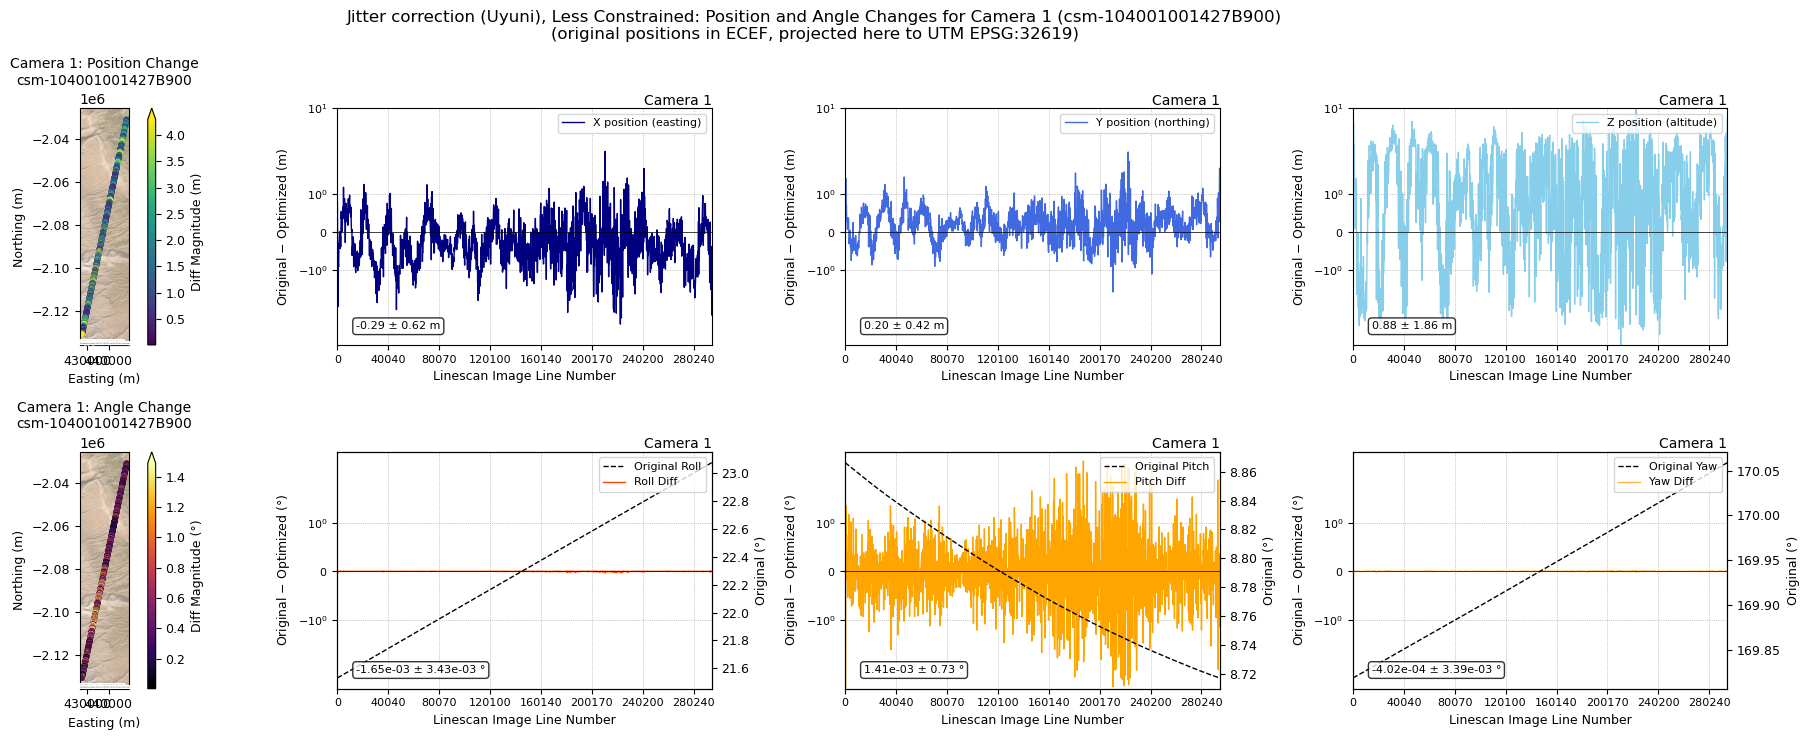
Single Camera Comparison#
You can also analyze a single satellite by passing only cam1_list.
csm_camera_summary_plot(
    cam1_list,
    map_crs=map_crs,
    title=title,
    trim=True,
    shared_scales=True,
    log_scale_positions=True,
    log_scale_angles=True,
    upper_magnitude_percentile=95,
    figsize=(20, 15),
    add_basemap=True,
    **ctx_kwargs
)
The Kernel crashed while executing code in the current cell or a previous cell.

Please review the code in the cell(s) to identify a possible cause of the failure.

Click <a href='https://aka.ms/vscodeJupyterKernelCrash'>here</a> for more info.

View Jupyter <a href='command:jupyter.viewOutput'>log</a> for further details.