gallery#
The gallery command-line tool creates a single figure laying out many DEMs as a grid of thumbnails that share one global color scale and colorbar. It is useful for QA’ing a stack of ASP outputs — e.g. multi-date or multi-pair DEMs over the same area — at a glance.
Each DEM is rendered with the same convention used elsewhere in the package (a gray hillshade underlay with a semi-transparent viridis DEM on top). Panels are sized to the rasters’ aspect ratio and packed tightly, and each panel is titled with its filename auto-shrunk to fit the panel width.
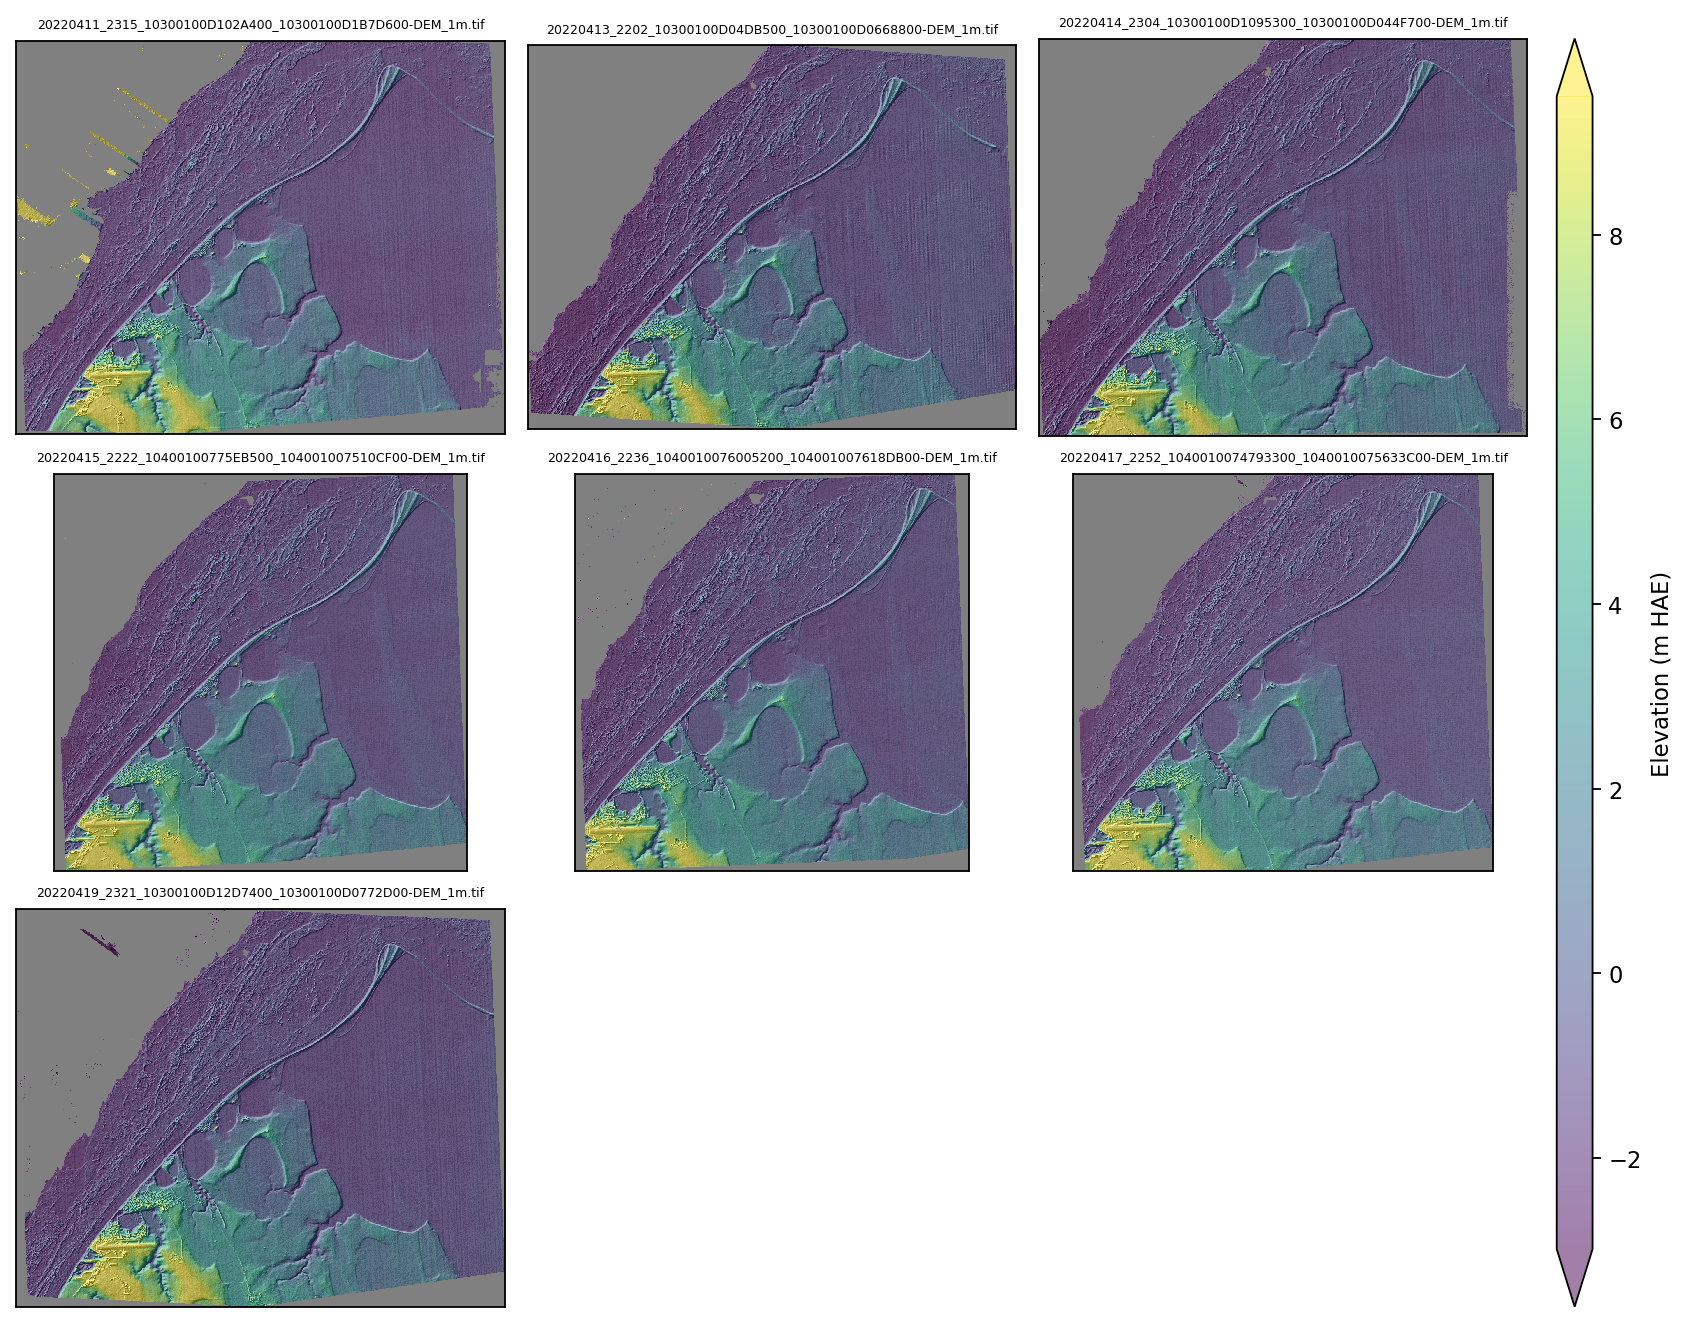
A gallery of seven repeat WorldView DEMs over the same area, sharing a single elevation color scale and colorbar — produced with gallery --pattern "*-DEM_1m.tif".#
Basic usage#
Search a directory for DEMs with a glob pattern:
gallery --directory /path/to/dems --pattern "*-DEM.tif"
By default, the tool saves the output as <directory_name>_gallery.png in the input directory.
DEMs in subdirectories#
Globbing is recursive, so ** descends into subdirectories — handy for the common ASP layout where each pair lives in its own subdirectory:
# any depth
gallery --directory /path/to/runs --pattern "**/*-DEM.tif"

# exactly one subdirectory deep
gallery --directory /path/to/runs --pattern "*/*-DEM.tif"
Explicit file list#
Pass files directly instead of a directory + pattern (explicit files take precedence):
gallery /path/to/dems/scene1-DEM.tif /path/to/dems/scene2-DEM.tif
Custom output location#
gallery --directory /path/to/dems \
        --pattern "*-DEM.tif" \
        --output_directory /path/to/save/plots \
        --output_filename custom_output.png
Controlling appearance and file size#
The output resolution is matched to the rendered detail so thumbnails stay crisp when zoomed, while an automatic dpi cap keeps the PNG under --max_filesize_mb (default 10) regardless of how many rasters are plotted. Disable the hillshade underlay or change the colormap as needed:
gallery --directory /path/to/dems \
        --pattern "*-DEM.tif" \
        --no-hillshade \
        --cmap inferno \
        --max_filesize_mb 8
Full options#
Usage: gallery [OPTIONS] [FILES]...

  Generate a gallery figure of many DEMs sharing a single color scale.

  Provide either a --directory (searched with --pattern) or an explicit list
  of FILES. Explicit files take precedence over the directory + pattern.

Options:
  --directory TEXT              Directory to search for rasters. Default:
                                current directory.
  --pattern TEXT                Glob pattern for rasters within the directory;
                                recursive '**' matches subdirectories (e.g.
                                '**/*-DEM.tif'). Default: '*-DEM.tif'.
  --hillshade / --no-hillshade  Draw a gray hillshade underlay beneath each
                                DEM. Default: True.
  --cmap TEXT                   Colormap for the DEMs. Default: viridis.
  --downsample TEXT             Downsample factor for reads, or 'auto' to size
                                thumbnails automatically. Default: auto.
  --max_filesize_mb FLOAT       Soft cap on the output PNG size in MB; auto
                                dpi is reduced to respect it. Default: 10.
  --title TEXT                  Figure suptitle. Default: none.
  --output_directory TEXT       Directory to save the output plot. Default:
                                Input directory.
  --output_filename TEXT        Filename for the output plot. Default:
                                Directory name with _gallery.png suffix.
  --help                        Show this message and exit.
Python API#
The same functionality is available via the GalleryPlotter class:
from asp_plot.gallery import GalleryPlotter

gallery = GalleryPlotter.from_directory("/path/to/dems", pattern="*-DEM.tif")
gallery.plot_gallery(save_dir="/path/to/output", fig_fn="dem_gallery.png")