Example plotting following ASP Docs Section 8.3 for Mars Reconnaissance Orbiter (MRO) CTX camera#
Below are example asp_plot outputs following the processing in ASP Docs Mars CTX example Section 8.3.
Retrieve .IMG files:
wget https://planetarydata.jpl.nasa.gov/img/data/mro/ctx/mrox_0031/data/P02_001981_1823_XI_02N356W.IMG

wget https://planetarydata.jpl.nasa.gov/img/data/mro/ctx/mrox_0042/data/P03_002258_1817_XI_01N356W.IMG
Install ISIS and pre-process the images for stereo:
ISIS> mroctx2isis from=P02_001981_1823_XI_02N356W.IMG to=P02_001981_1823.cub
ISIS> mroctx2isis from=P03_002258_1817_XI_01N356W.IMG to=P03_002258_1817.cub
ISIS> spiceinit from=P02_001981_1823.cub web=false
ISIS> spiceinit from=P03_002258_1817.cub web=false
ISIS> ctxcal from=P02_001981_1823.cub to=P02_001981_1823.cal.cub
ISIS> ctxcal from=P03_002258_1817.cub to=P03_002258_1817.cal.cub
ISIS> cam2map4stereo.py P02_001981_1823.cal.cub P03_002258_1817.cal.cub
Run stereo processing and point2dem:
parallel_stereo                                      \
  --stereo-algorithm asp_mgm --subpixel-mode 9       \
  P02_001981_1823.map.cub P03_002258_1817.map.cub    \
        results/out

point2dem -r mars --stereographic --auto-proj-center \
  results/out-PC.tif
Full report#
Example command for full stereo-processing report
directory = "~/Desktop/asp-plot-examples/mars_ctx/"
stereo_directory = "results/"
!asp_plot \
  --directory $directory \
  --stereo_directory $stereo_directory \
  --subset_km 1 \
  --add_basemap False \
  --plot_icesat False \
  --plot_geometry False
Individual plots#
Example modular usage of asp_plot for this example processing.
Processing Parameters#
%load_ext autoreload
%autoreload 2

from asp_plot.processing_parameters import ProcessingParameters
processing_parameters = ProcessingParameters(
    processing_directory=directory,
    stereo_directory=stereo_directory
)
processing_parameters_dict = processing_parameters.from_log_files()

print(f"Processed on: {processing_parameters_dict['processing_timestamp']}\n")

print(f"Reference DEM: {processing_parameters_dict['reference_dem']}\n")

print(f"Bundle adjustment ({processing_parameters_dict['bundle_adjust_run_time']}):\n")
print(processing_parameters_dict["bundle_adjust"])

print(f"\nStereo ({processing_parameters_dict['stereo_run_time']}):\n")
print(processing_parameters_dict["stereo"])

print(f"\nPoint2dem ({processing_parameters_dict['point2dem_run_time']}):\n")
print(processing_parameters_dict["point2dem"])
Processed on: 2025-10-31 11:17:37

Reference DEM:

Bundle adjustment (N/A):

Bundle adjustment not run

Stereo (1 hours and 5 minutes):

stereo --stereo-algorithm asp_mgm --subpixel-mode 9 --corr-seed-mode 1 --compute-point-cloud-center-only --threads 40 P02_001981_1823.map.cub P03_002258_1817.map.cub results/out

Point2dem (0 hours and 11 minutes):

point2dem -r mars --stereographic --auto-proj-center results/out-PC.tif
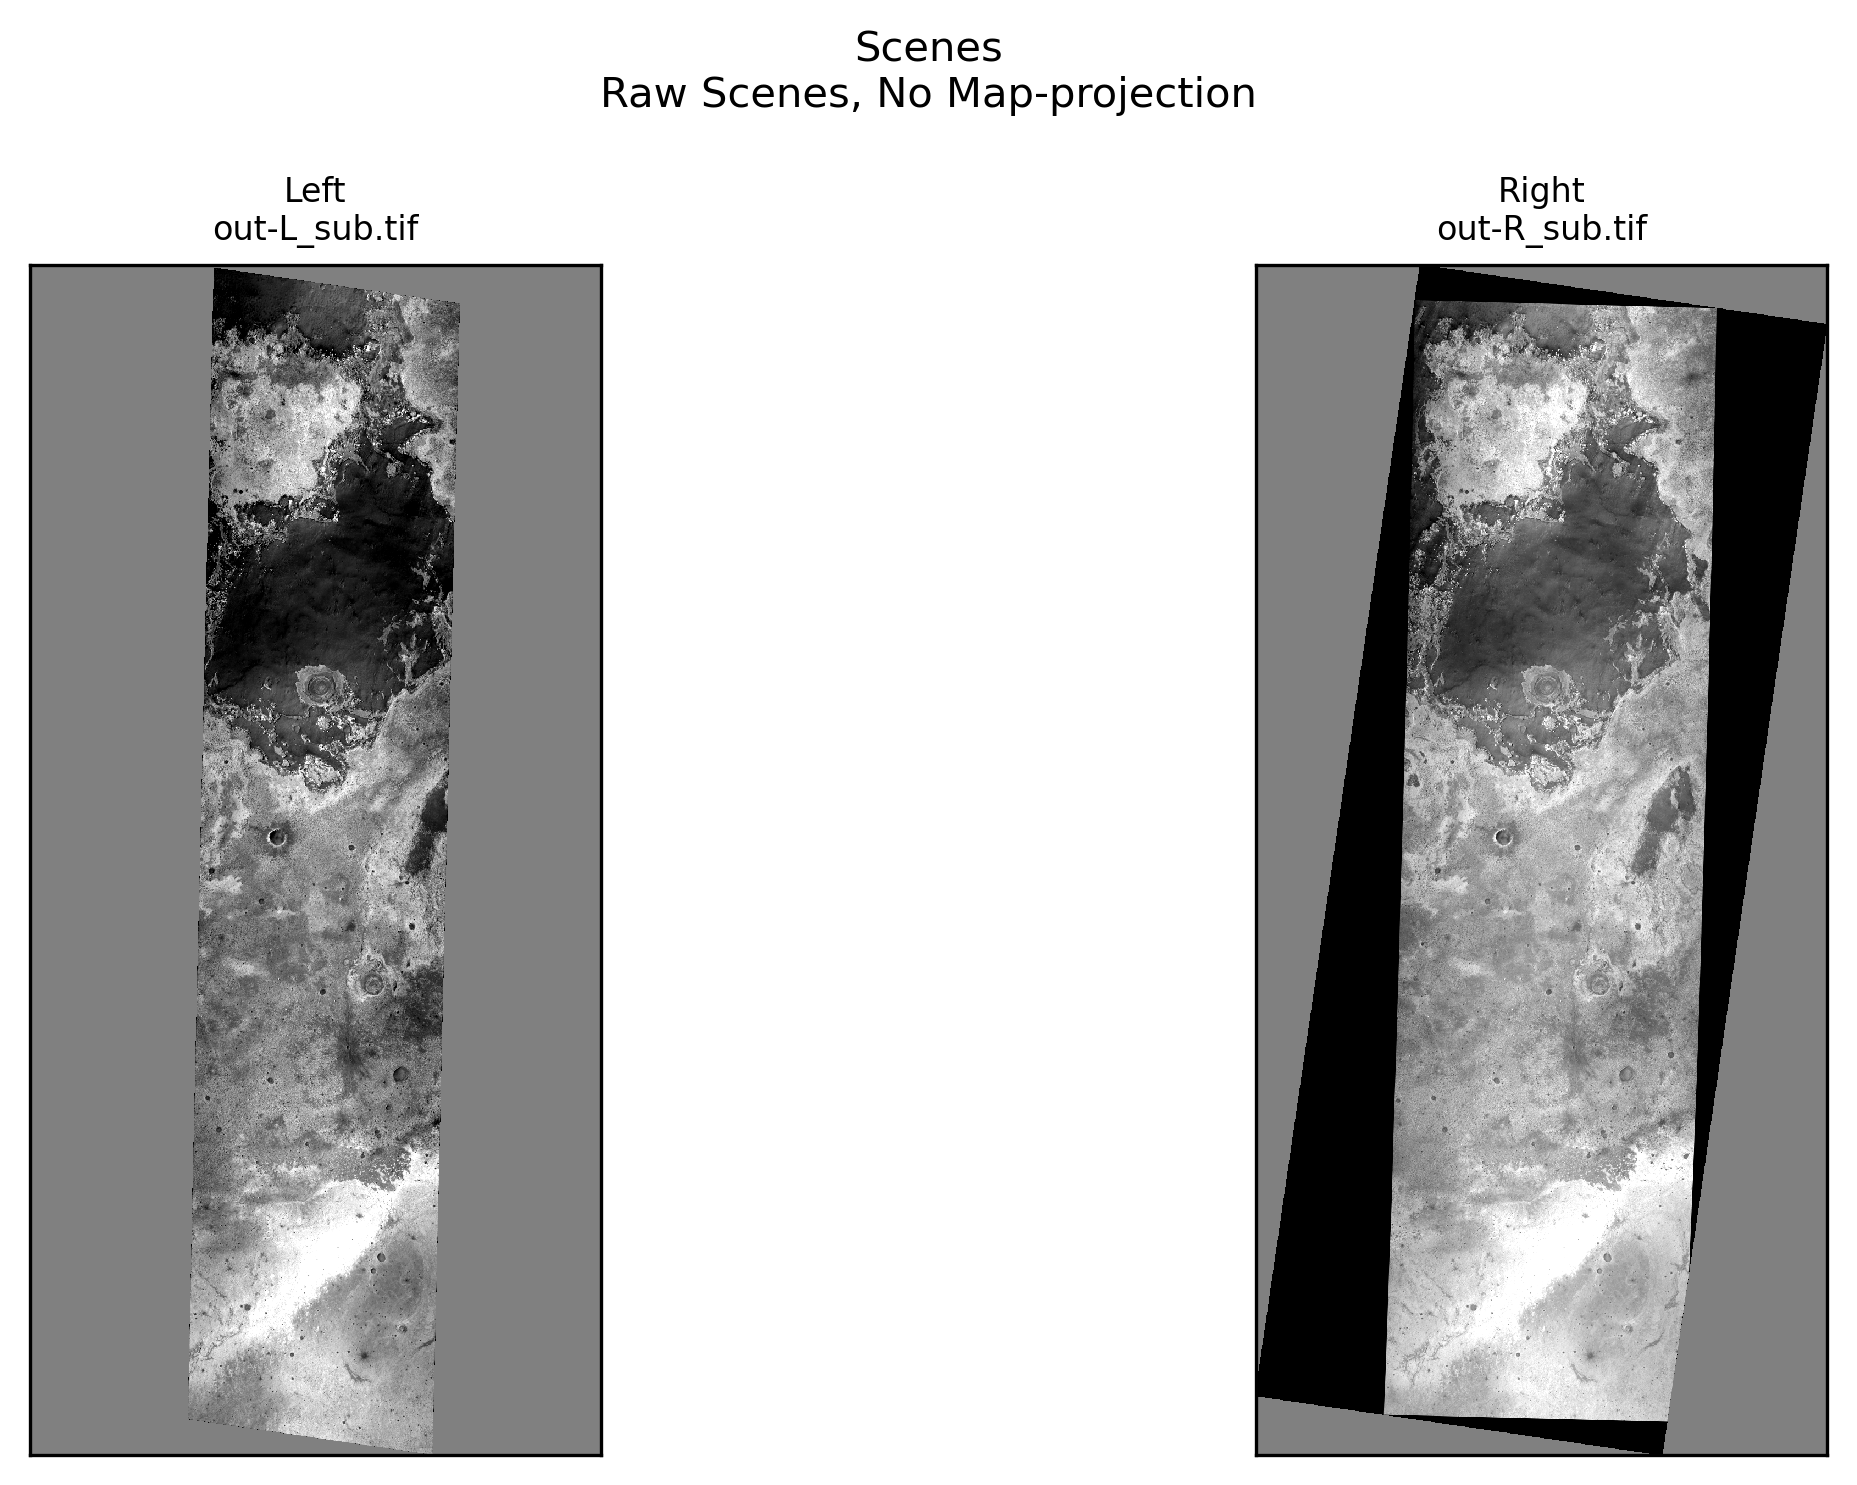
Scene Plots#
from asp_plot.scenes import ScenePlotter
plotter = ScenePlotter(
  directory,
  stereo_directory,
  title="Scenes"
)

plotter.plot_scenes()
Stereo Plots#
from asp_plot.stereo import StereoPlotter
plotter = StereoPlotter(
  directory,
  stereo_directory
)
WARNING:asp_plot.stereo:

No reference DEM found in log files. Please supply the reference DEM you used during stereo processing (or another reference DEM) if you would like to see some difference maps.


WARNING:asp_plot.utils:Could not find ('*-IntersectionErr.tif',) in ~/Desktop/asp-plot-examples/mars_ctx/results/. Some plots may be missing.
ASP DEM: ~/Desktop/asp-plot-examples/mars_ctx/results/out-DEM.tif
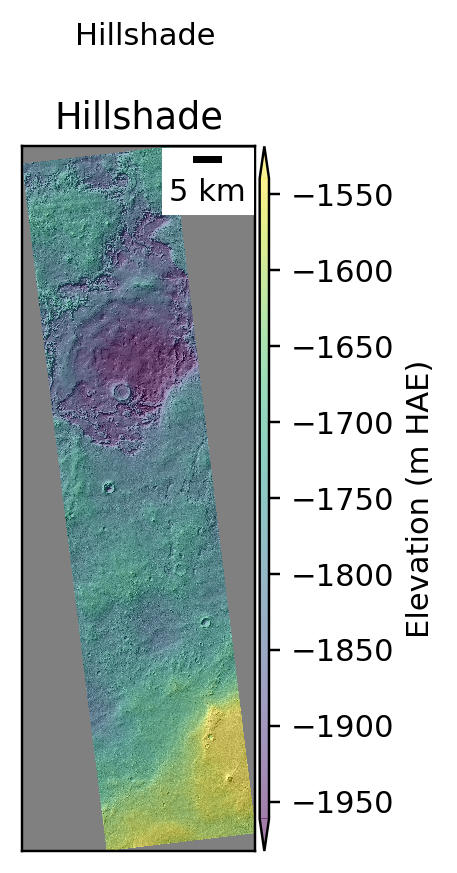
plotter.title = "Hillshade"

plotter.plot_detailed_hillshade()
WARNING:asp_plot.stereo:

Intersection error file not found. Plotting hillshade without details.


/Users/ben/miniforge3/envs/asp_plot/lib/python3.13/site-packages/osgeo/gdal.py:311: FutureWarning: Neither gdal.UseExceptions() nor gdal.DontUseExceptions() has been explicitly called. In GDAL 4.0, exceptions will be enabled by default.
  warnings.warn(
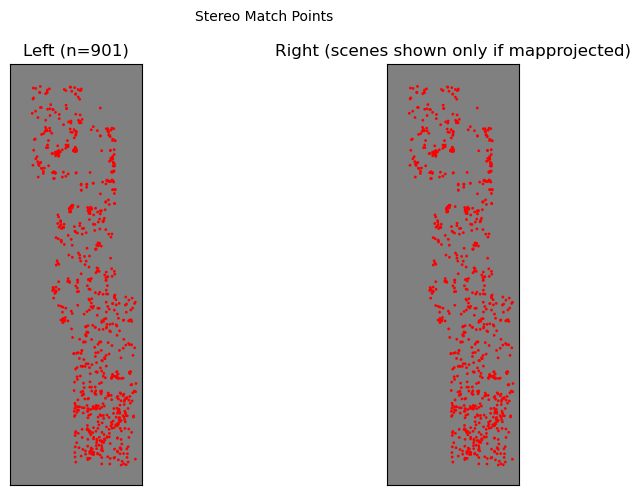
plotter.title="Stereo Match Points"

plotter.plot_match_points()
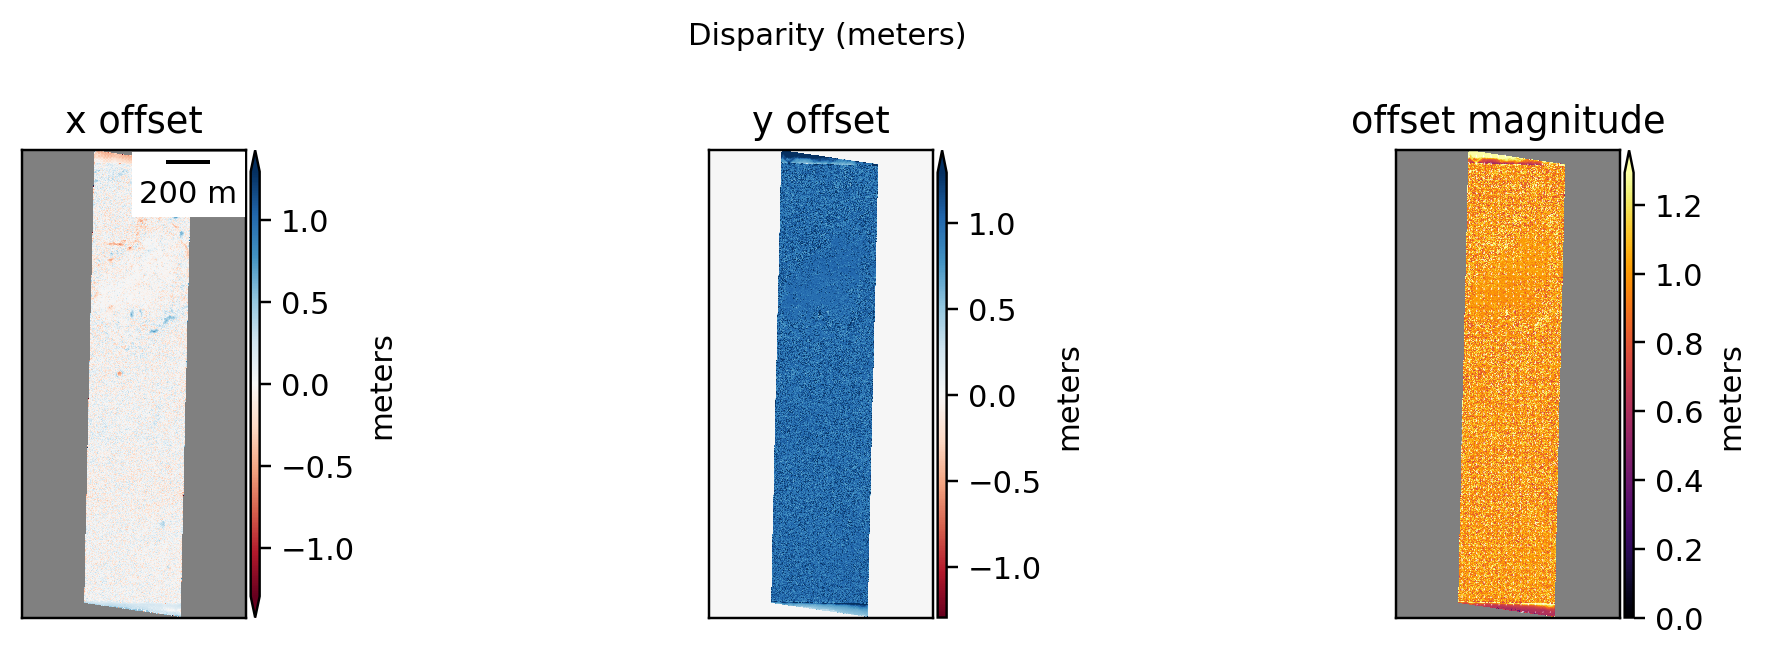
plotter.title = "Disparity (meters)"

plotter.plot_disparity(
  unit="meters",
  quiver=True,
)
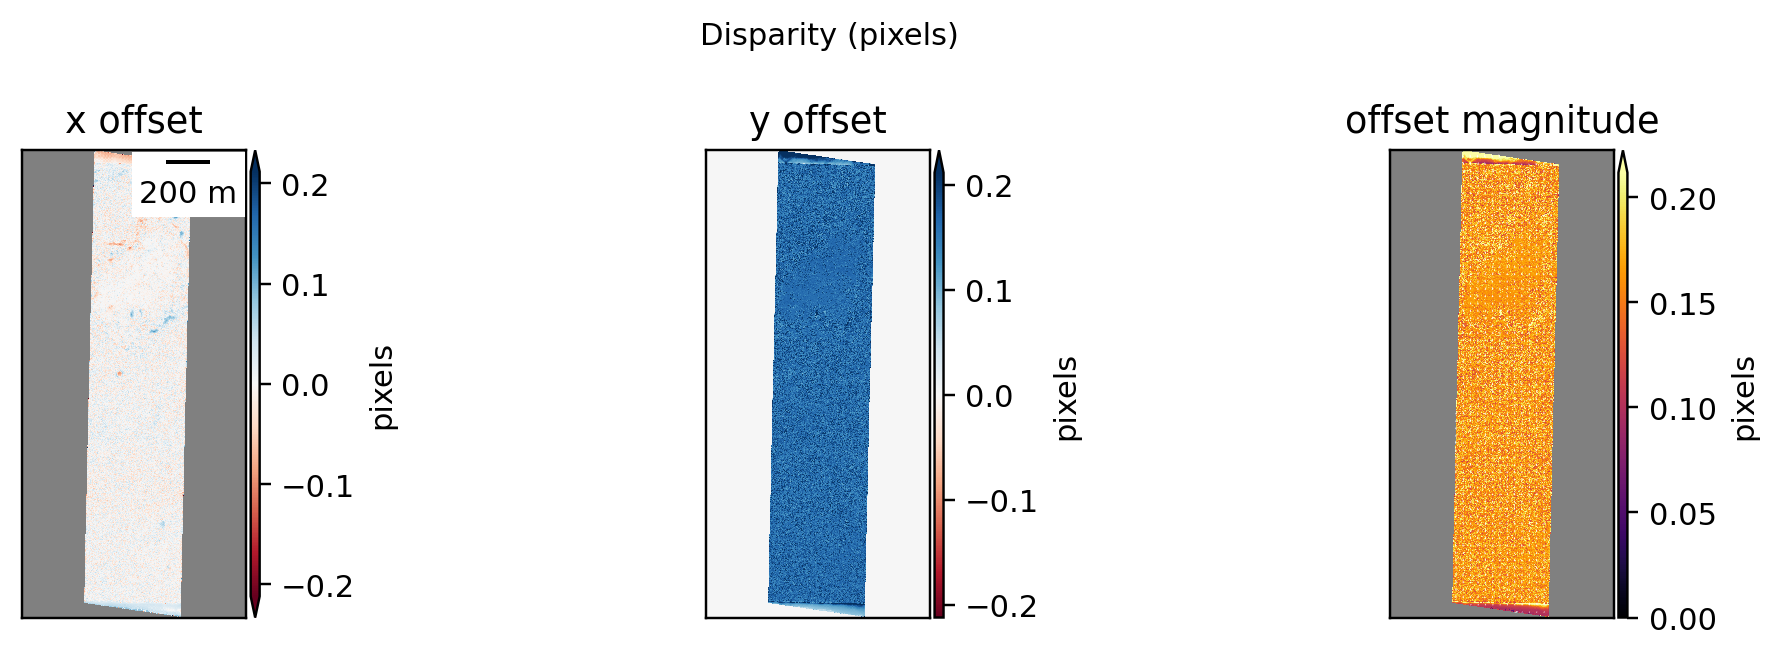
plotter.title = "Disparity (pixels)"

plotter.plot_disparity(
  unit="pixels",
  quiver=True,
)
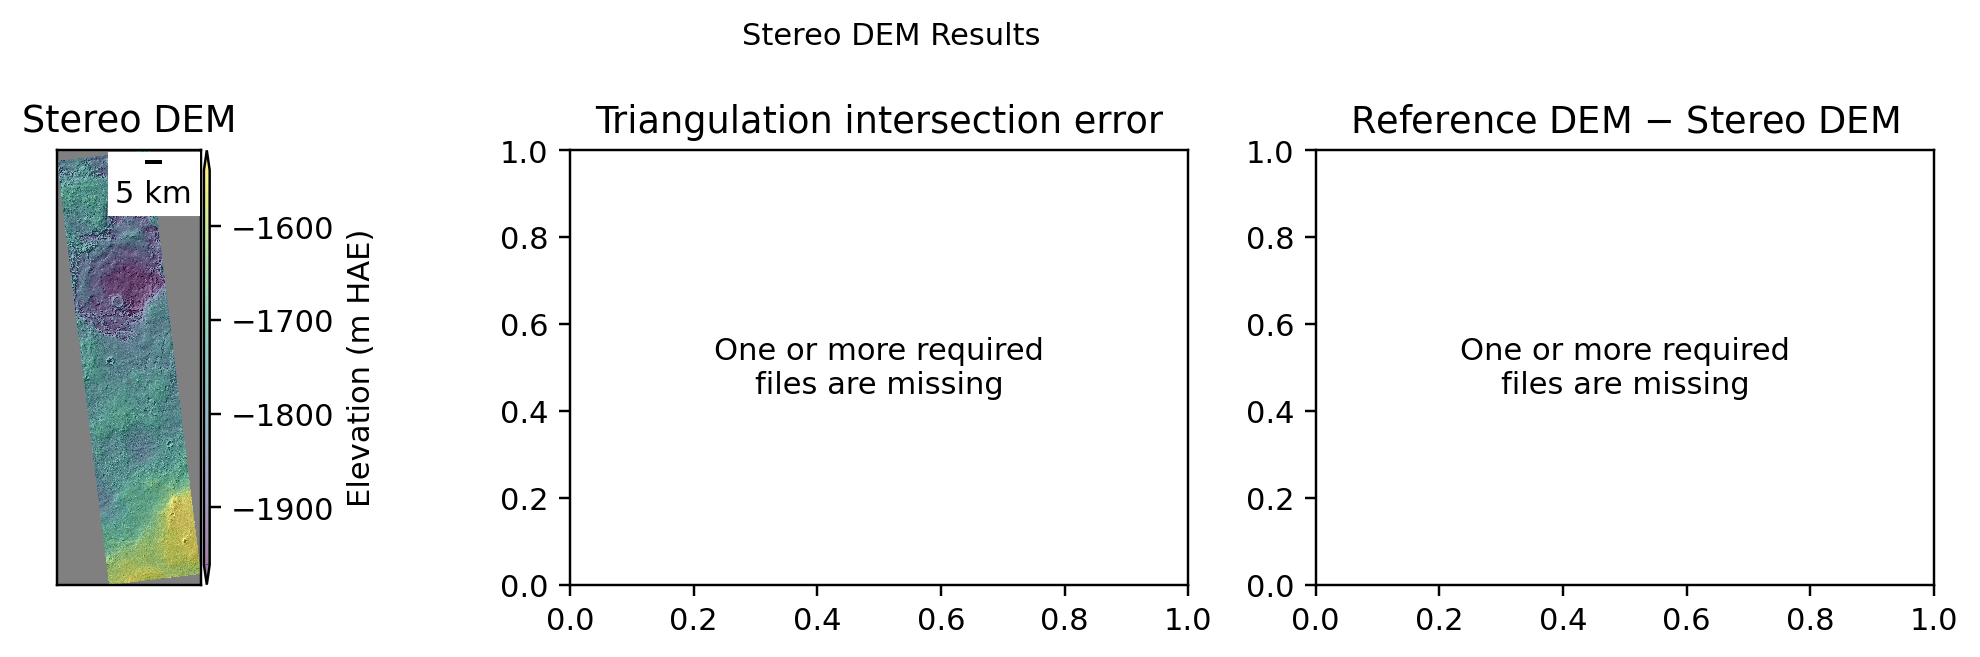
plotter.title = "Stereo DEM Results"

plotter.plot_dem_results()
Plotting DEM results. This can take a minute for large inputs.
WARNING:asp_plot.utils:Could not find ('*DEM*diff.tif',) in ~/Desktop/asp-plot-examples/mars_ctx/results/. Some plots may be missing.