Example plotting following ASP Docs ASTER example for ASTER with mapprojection#
Below are example asp_plot outputs following the processing in the ASP Docs ASTER example.
We diverge from the documentation example data, instead retrieving the example data used in https://github.com/uw-cryo/asp_tutorials:
Note on ASTER L1A data format change: In December 2025, NASA decommissioned the ASTER L1A Version 003 product (distributed as a
.zipof GeoTIFF images and text geometry files) and replaced it with Version 004 (distributed as a single HDF-EOS2.hdffile). The Zenodo archive below preserves the old V003 format. If you are downloading new ASTER data from NASA Earthdata, you will receive V004 HDF files instead. Both formats are supported byaster2asp(HDF support requires ASP build 2026-01-28 or later). See the aster2asp documentation for details.
Option A: V003 data from Zenodo (legacy format)
wget https://zenodo.org/record/7972223/files/AST_L1A_00307312017190728_20200218153629_19952.zip

mkdir dataDir

tar xvf AST_L1A_00307312017190728_20200218153629_19952.zip -C dataDir
Option B: V004 data from NASA Earthdata (current format)
Download an ASTER L1A .hdf file from NASA Earthdata.
Pre-process the images for stereo:
# For V003 directory input:
aster2asp dataDir -o out

# For V004 HDF input:
aster2asp input.hdf -o out
Both produce the same output:
out-Band3B.tif
out-Band3B.xml
out-Band3N.tif
out-Band3N.xml
Run stereo processing and point2dem without initial mapprojection:
parallel_stereo -t aster         \
  --stereo-algorithm asp_mgm     \
  --subpixel-mode 9              \
  --aster-use-csm                \
   out-Band3N.tif out-Band3B.tif \
   out-Band3N.xml out-Band3B.xml \
   out_stereo/run

point2dem -r earth --auto-proj-center \
  --errorimage \
  out_stereo/run-PC.tif
Followed by re-processing with the additional mapprojection step onto a low-res output:
point2dem -r earth --auto-proj-center \
  --tr 200 out_stereo/run-PC.tif      \
  -o out_stereo/run-200m

mapproject --tr 15 --aster-use-csm \
  out_stereo/run-200m-DEM.tif      \
  out-Band3N.tif out-Band3N.xml out-Band3N_proj.tif

mapproject --tr 15 --aster-use-csm \
  out_stereo/run-200m-DEM.tif      \
  out-Band3B.tif out-Band3B.xml out-Band3B_proj.tif

parallel_stereo -t aster                  \
  --stereo-algorithm asp_mgm              \
  --subpixel-mode 9                       \
  --aster-use-csm                         \
  out-Band3N_proj.tif out-Band3B_proj.tif \
  out-Band3N.xml out-Band3B.xml           \
  out_stereo_proj/run                     \
  out_stereo/run-200m-DEM.tif

point2dem -r earth --auto-proj-center \
  --errorimage \
  out_stereo_proj/run-PC.tif
The results with and without mapprojection are displayed below.
Full report#
Example command for full stereo-processing report
No Mapprojection#
directory = "~/Desktop/asp-plot-examples/aster/"
stereo_directory = "out_stereo/"
!asp_plot \
  --directory $directory \
  --stereo_directory $stereo_directory \
  --dem_filename run-DEM.tif \
  --subset_km 5 \
  --plot_altimetry True \
  --plot_geometry False \
  --report_filename ../../reports/ASTER-asp-plot-report.pdf
Processing ASP files in /Users/ben/Desktop/asp-plot-examples/aster/

WARNING:asp_plot.stereo:

No reference DEM found in log files. Please supply the reference DEM you used during stereo processing (or another reference DEM) if you would like to see some difference maps.


ASP DEM: /Users/ben/Desktop/asp-plot-examples/aster/out_stereo/run-DEM.tif


Using map projection from DEM: EPSG:32610

Figure saved to /Users/ben/Desktop/asp-plot-examples/aster/tmp_asp_report_plots/00.png
Figure saved to /Users/ben/Desktop/asp-plot-examples/aster/tmp_asp_report_plots/01.png
Figure saved to /Users/ben/Desktop/asp-plot-examples/aster/tmp_asp_report_plots/02.png
Plotting DEM results. This can take a minute for large inputs.
WARNING:asp_plot.utils:Could not find ('*diff.tif',) in /Users/ben/Desktop/asp-plot-examples/aster/out_stereo/. Some plots may be missing.
Figure saved to /Users/ben/Desktop/asp-plot-examples/aster/tmp_asp_report_plots/03.png
Figure saved to /Users/ben/Desktop/asp-plot-examples/aster/tmp_asp_report_plots/04.png

Detected planetary body: earth

Time filter: 2018-10-14T00:00:00Z to 2026-04-14T00:00:00Z (all available)

ICESat-2 ATL06 request processing for: all
{'poly': [{'lon': -122.35267767981371, 'lat': 46.69597200416099}, {'lon': -122.35267767981371, 'lat': 47.35581707303874}, {'lon': -121.3377266168241, 'lat': 47.35581707303874}, {'lon': -121.3377266168241, 'lat': 46.69597200416099}, {'lon': -122.35267767981371, 'lat': 46.69597200416099}], 't0': '2018-10-14T00:00:00Z', 't1': '2026-04-14T00:00:00Z', 'res': 20, 'len': 40, 'ats': 20, 'fit': {'maxi': 6}, 'cnf': 'atl03_high', 'srt': -1, 'cnt': 10}
Existing file found, reading in: /Users/ben/Desktop/asp-plot-examples/aster/atl06sr_all.parquet
Filtering ATL06-SR all
  Outlier filter (3σ): all 886472 → 868791 (removed 17681)
Figure saved to /Users/ben/Desktop/asp-plot-examples/aster/tmp_asp_report_plots/05.png
Figure saved to /Users/ben/Desktop/asp-plot-examples/aster/tmp_asp_report_plots/06.png
Figure saved to /Users/ben/Desktop/asp-plot-examples/aster/tmp_asp_report_plots/07.png
Figure saved to /Users/ben/Desktop/asp-plot-examples/aster/tmp_asp_report_plots/08.png


Report saved to ../../reports/ASTER-asp-plot-report.pdf
Mapprojection#
mp_stereo_directory = "out_stereo_proj/"
reference_dem = f"{directory}{stereo_directory}run-200m-DEM.tif"
!asp_plot \
  --directory $directory \
  --stereo_directory $mp_stereo_directory \
  --dem_filename run-DEM.tif \
  --reference_dem $reference_dem \
  --subset_km 5 \
  --plot_altimetry True \
  --plot_geometry False \
  --report_filename ../../reports/ASTER_mapproj-asp-plot-report.pdf
Processing ASP files in /Users/ben/Desktop/asp-plot-examples/aster/


Reference DEM: /Users/ben/Desktop/asp-plot-examples/aster/out_stereo/run-200m-DEM.tif

WARNING:asp_plot.utils:Could not find ('*-align-L.txt',) in /Users/ben/Desktop/asp-plot-examples/aster/out_stereo_proj/. Some plots may be missing.
WARNING:asp_plot.utils:Could not find ('*-align-R.txt',) in /Users/ben/Desktop/asp-plot-examples/aster/out_stereo_proj/. Some plots may be missing.

ASP DEM: /Users/ben/Desktop/asp-plot-examples/aster/out_stereo_proj/run-DEM.tif


Using map projection from DEM: EPSG:32610

Figure saved to /Users/ben/Desktop/asp-plot-examples/aster/tmp_asp_report_plots/00.png
Figure saved to /Users/ben/Desktop/asp-plot-examples/aster/tmp_asp_report_plots/01.png
Figure saved to /Users/ben/Desktop/asp-plot-examples/aster/tmp_asp_report_plots/02.png
Plotting DEM results. This can take a minute for large inputs.
WARNING:asp_plot.stereo:

Found a DEM of difference: /Users/ben/Desktop/asp-plot-examples/aster/out_stereo_proj/run-DEM_run-200m-DEM_diff.tif.
Using that for difference map plotting.


Figure saved to /Users/ben/Desktop/asp-plot-examples/aster/tmp_asp_report_plots/03.png
Figure saved to /Users/ben/Desktop/asp-plot-examples/aster/tmp_asp_report_plots/04.png

Detected planetary body: earth

Time filter: 2018-10-14T00:00:00Z to 2026-04-14T00:00:00Z (all available)

ICESat-2 ATL06 request processing for: all
{'poly': [{'lon': -122.34846522847539, 'lat': 46.699595216327424}, {'lon': -122.34846522847539, 'lat': 47.353178047956256}, {'lon': -121.3512354148296, 'lat': 47.353178047956256}, {'lon': -121.3512354148296, 'lat': 46.699595216327424}, {'lon': -122.34846522847539, 'lat': 46.699595216327424}], 't0': '2018-10-14T00:00:00Z', 't1': '2026-04-14T00:00:00Z', 'res': 20, 'len': 40, 'ats': 20, 'fit': {'maxi': 6}, 'cnf': 'atl03_high', 'srt': -1, 'cnt': 10}
Existing file found, reading in: /Users/ben/Desktop/asp-plot-examples/aster/atl06sr_all.parquet
Parameters don't match request. Regenerating...
  Sampling ESA WorldCover for 919387 points (1 tile(s))...
  WorldCover: 919387/919387 points sampled
Filtering ATL06-SR all
  Outlier filter (3σ): all 851411 → 834462 (removed 16949)
Figure saved to /Users/ben/Desktop/asp-plot-examples/aster/tmp_asp_report_plots/05.png
Figure saved to /Users/ben/Desktop/asp-plot-examples/aster/tmp_asp_report_plots/06.png
Figure saved to /Users/ben/Desktop/asp-plot-examples/aster/tmp_asp_report_plots/07.png
Figure saved to /Users/ben/Desktop/asp-plot-examples/aster/tmp_asp_report_plots/08.png


Report saved to ../../reports/ASTER_mapproj-asp-plot-report.pdf
Individual plots for mapprojected processing#
Example modular usage of asp_plot for this example processing. Only the mapprojected example plots are shown.
directory = "~/Desktop/asp-plot-examples/aster/"
stereo_directory = "out_stereo_proj/"
reference_dem = f"{directory}out_stereo/run-200m-DEM.tif"
Processing Parameters#
%load_ext autoreload
%autoreload 2

from asp_plot.processing_parameters import ProcessingParameters
processing_parameters = ProcessingParameters(
    processing_directory=directory,
    stereo_directory=stereo_directory
)
processing_parameters_dict = processing_parameters.from_log_files()

print(f"Processed on: {processing_parameters_dict['processing_timestamp']}\n")

print(f"Reference DEM: {processing_parameters_dict['reference_dem']}\n")

print(f"Bundle adjustment ({processing_parameters_dict['bundle_adjust_run_time']}):\n")
print(processing_parameters_dict["bundle_adjust"])

print(f"\nStereo ({processing_parameters_dict['stereo_run_time']}):\n")
print(processing_parameters_dict["stereo"])

print(f"\nPoint2dem ({processing_parameters_dict['point2dem_run_time']}):\n")
print(processing_parameters_dict["point2dem"])
Processed on: 2025-11-07 14:19:59

Reference DEM: out_stereo/run-200m-DEM.tif

Bundle adjustment (N/A):

Bundle adjustment not run

Stereo (0 hours and 14 minutes):

stereo -t aster --stereo-algorithm asp_mgm --subpixel-mode 9 --aster-use-csm out-Band3N_proj.tif out-Band3B_proj.tif out-Band3N.xml out-Band3B.xml out_stereo_proj/run out_stereo/run-200m-DEM.tif --corr-seed-mode 1 --sgm-collar-size 256 --compute-point-cloud-center-only --threads 8

Point2dem (0 hours and 0 minutes):

point2dem -r earth --auto-proj-center --errorimage out_stereo_proj/run-PC.tif
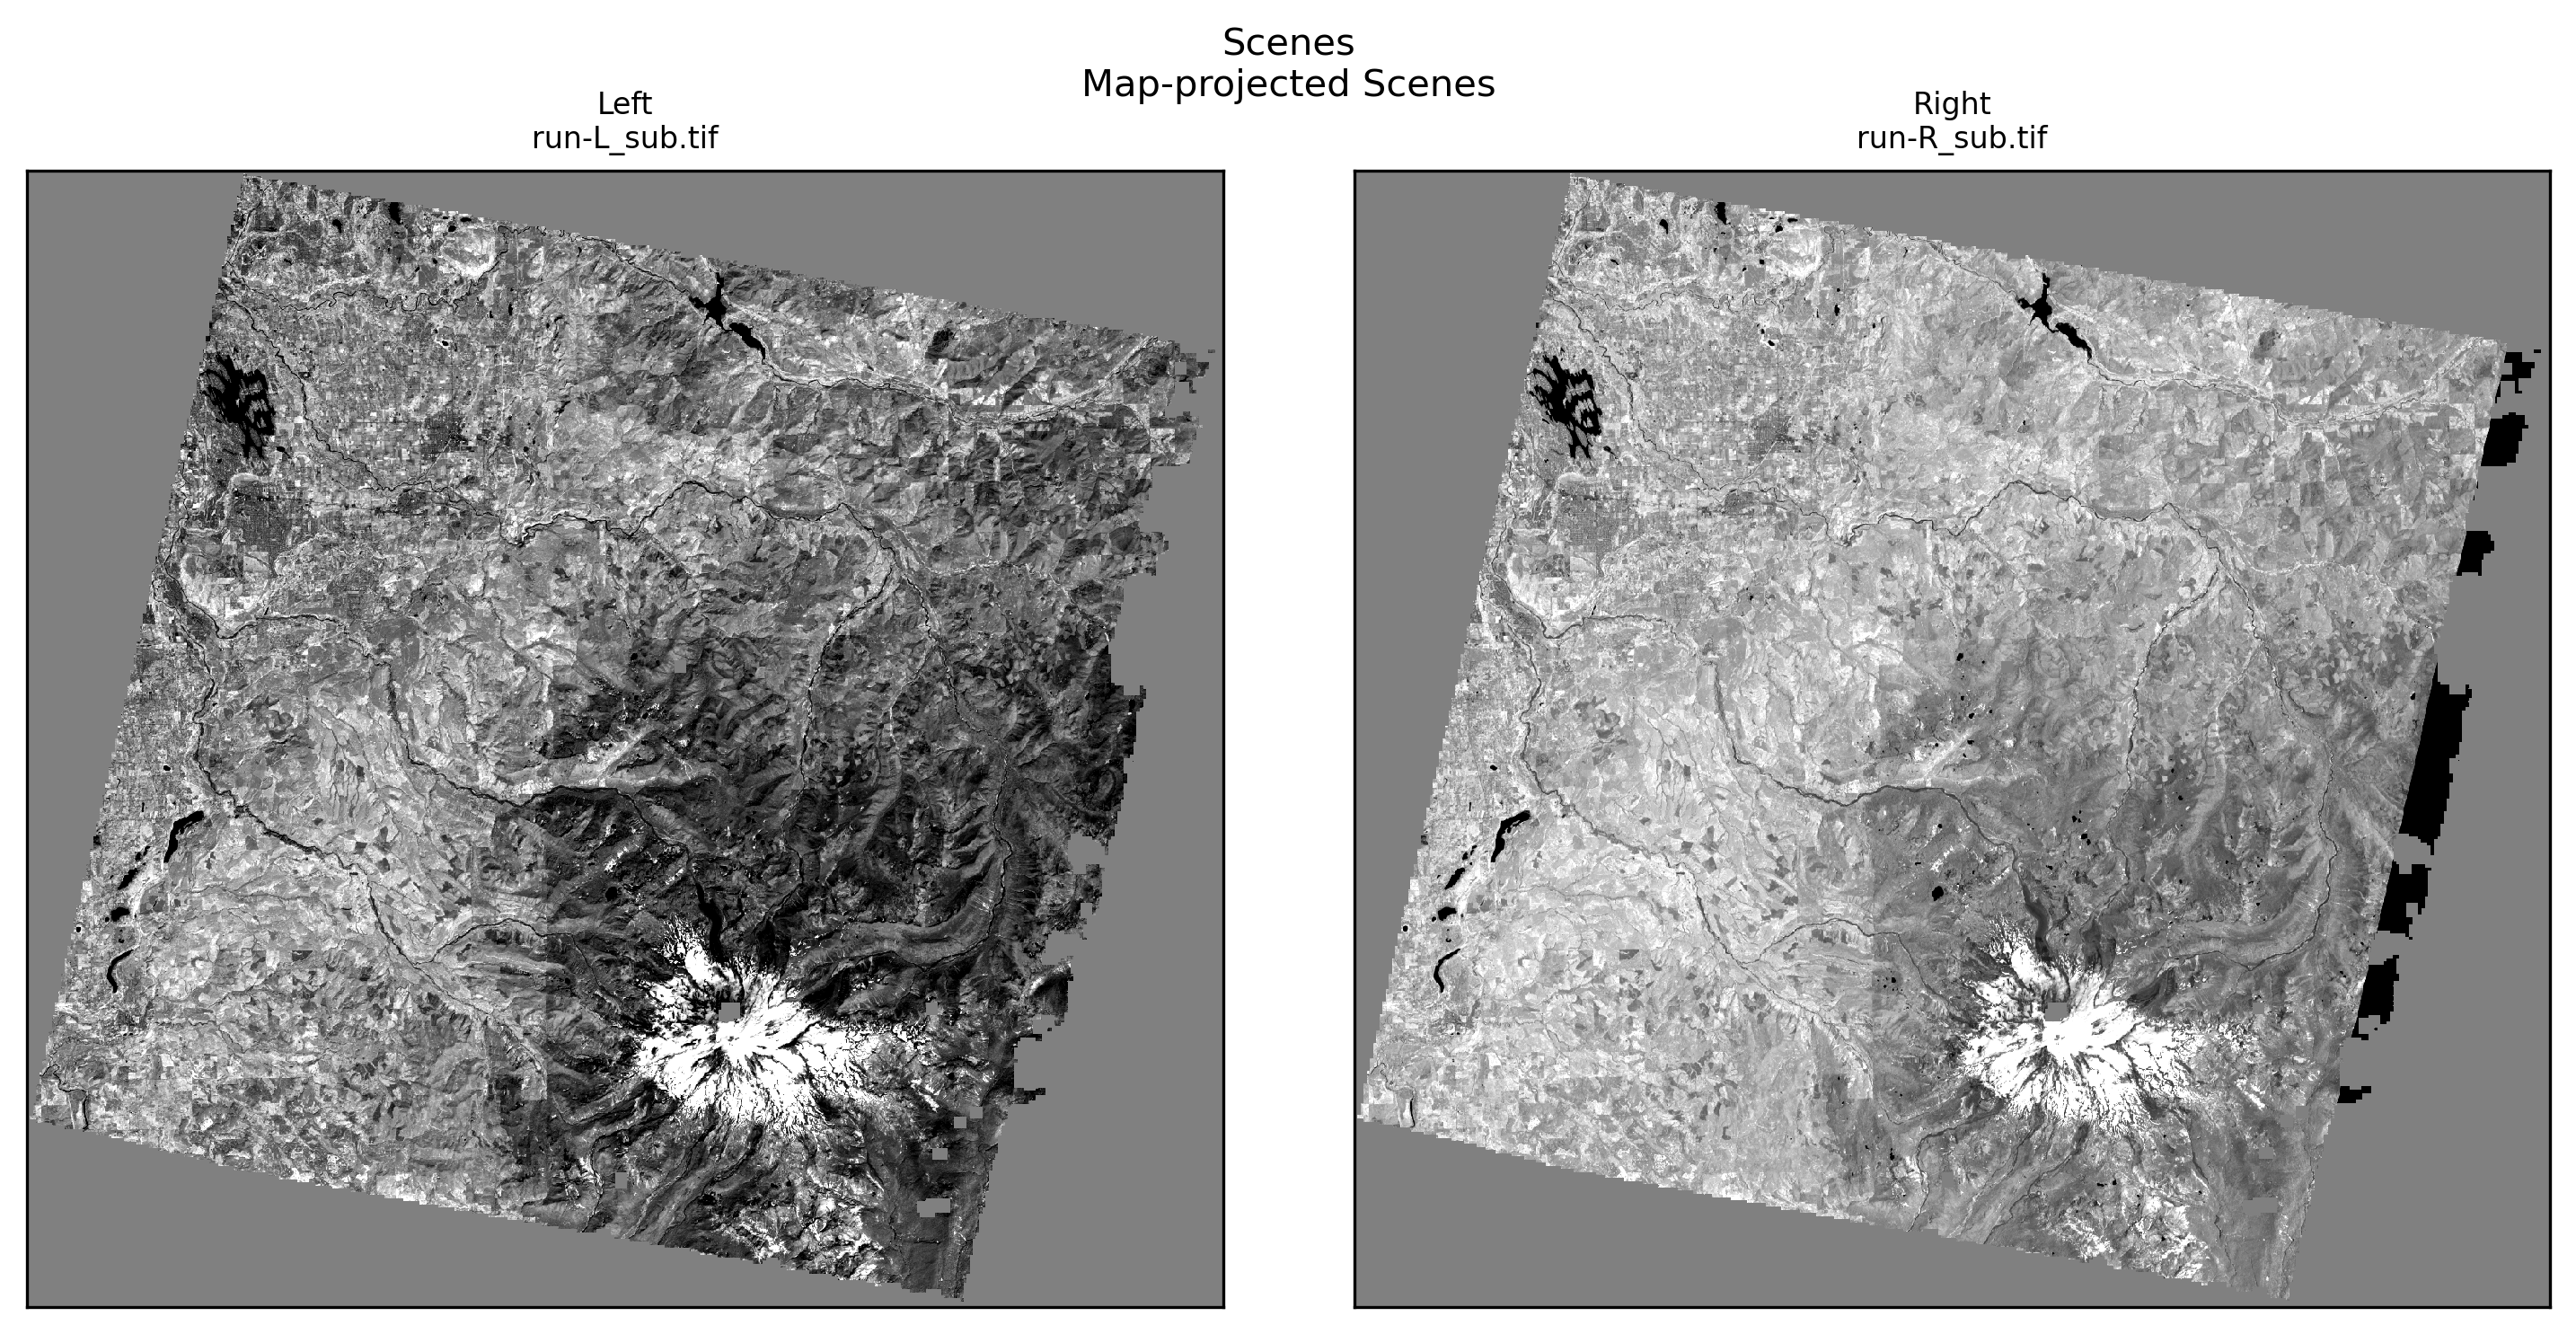
Scene Plots#
from asp_plot.scenes import ScenePlotter
plotter = ScenePlotter(
  directory,
  stereo_directory,
  title="Scenes"
)

plotter.plot_scenes()
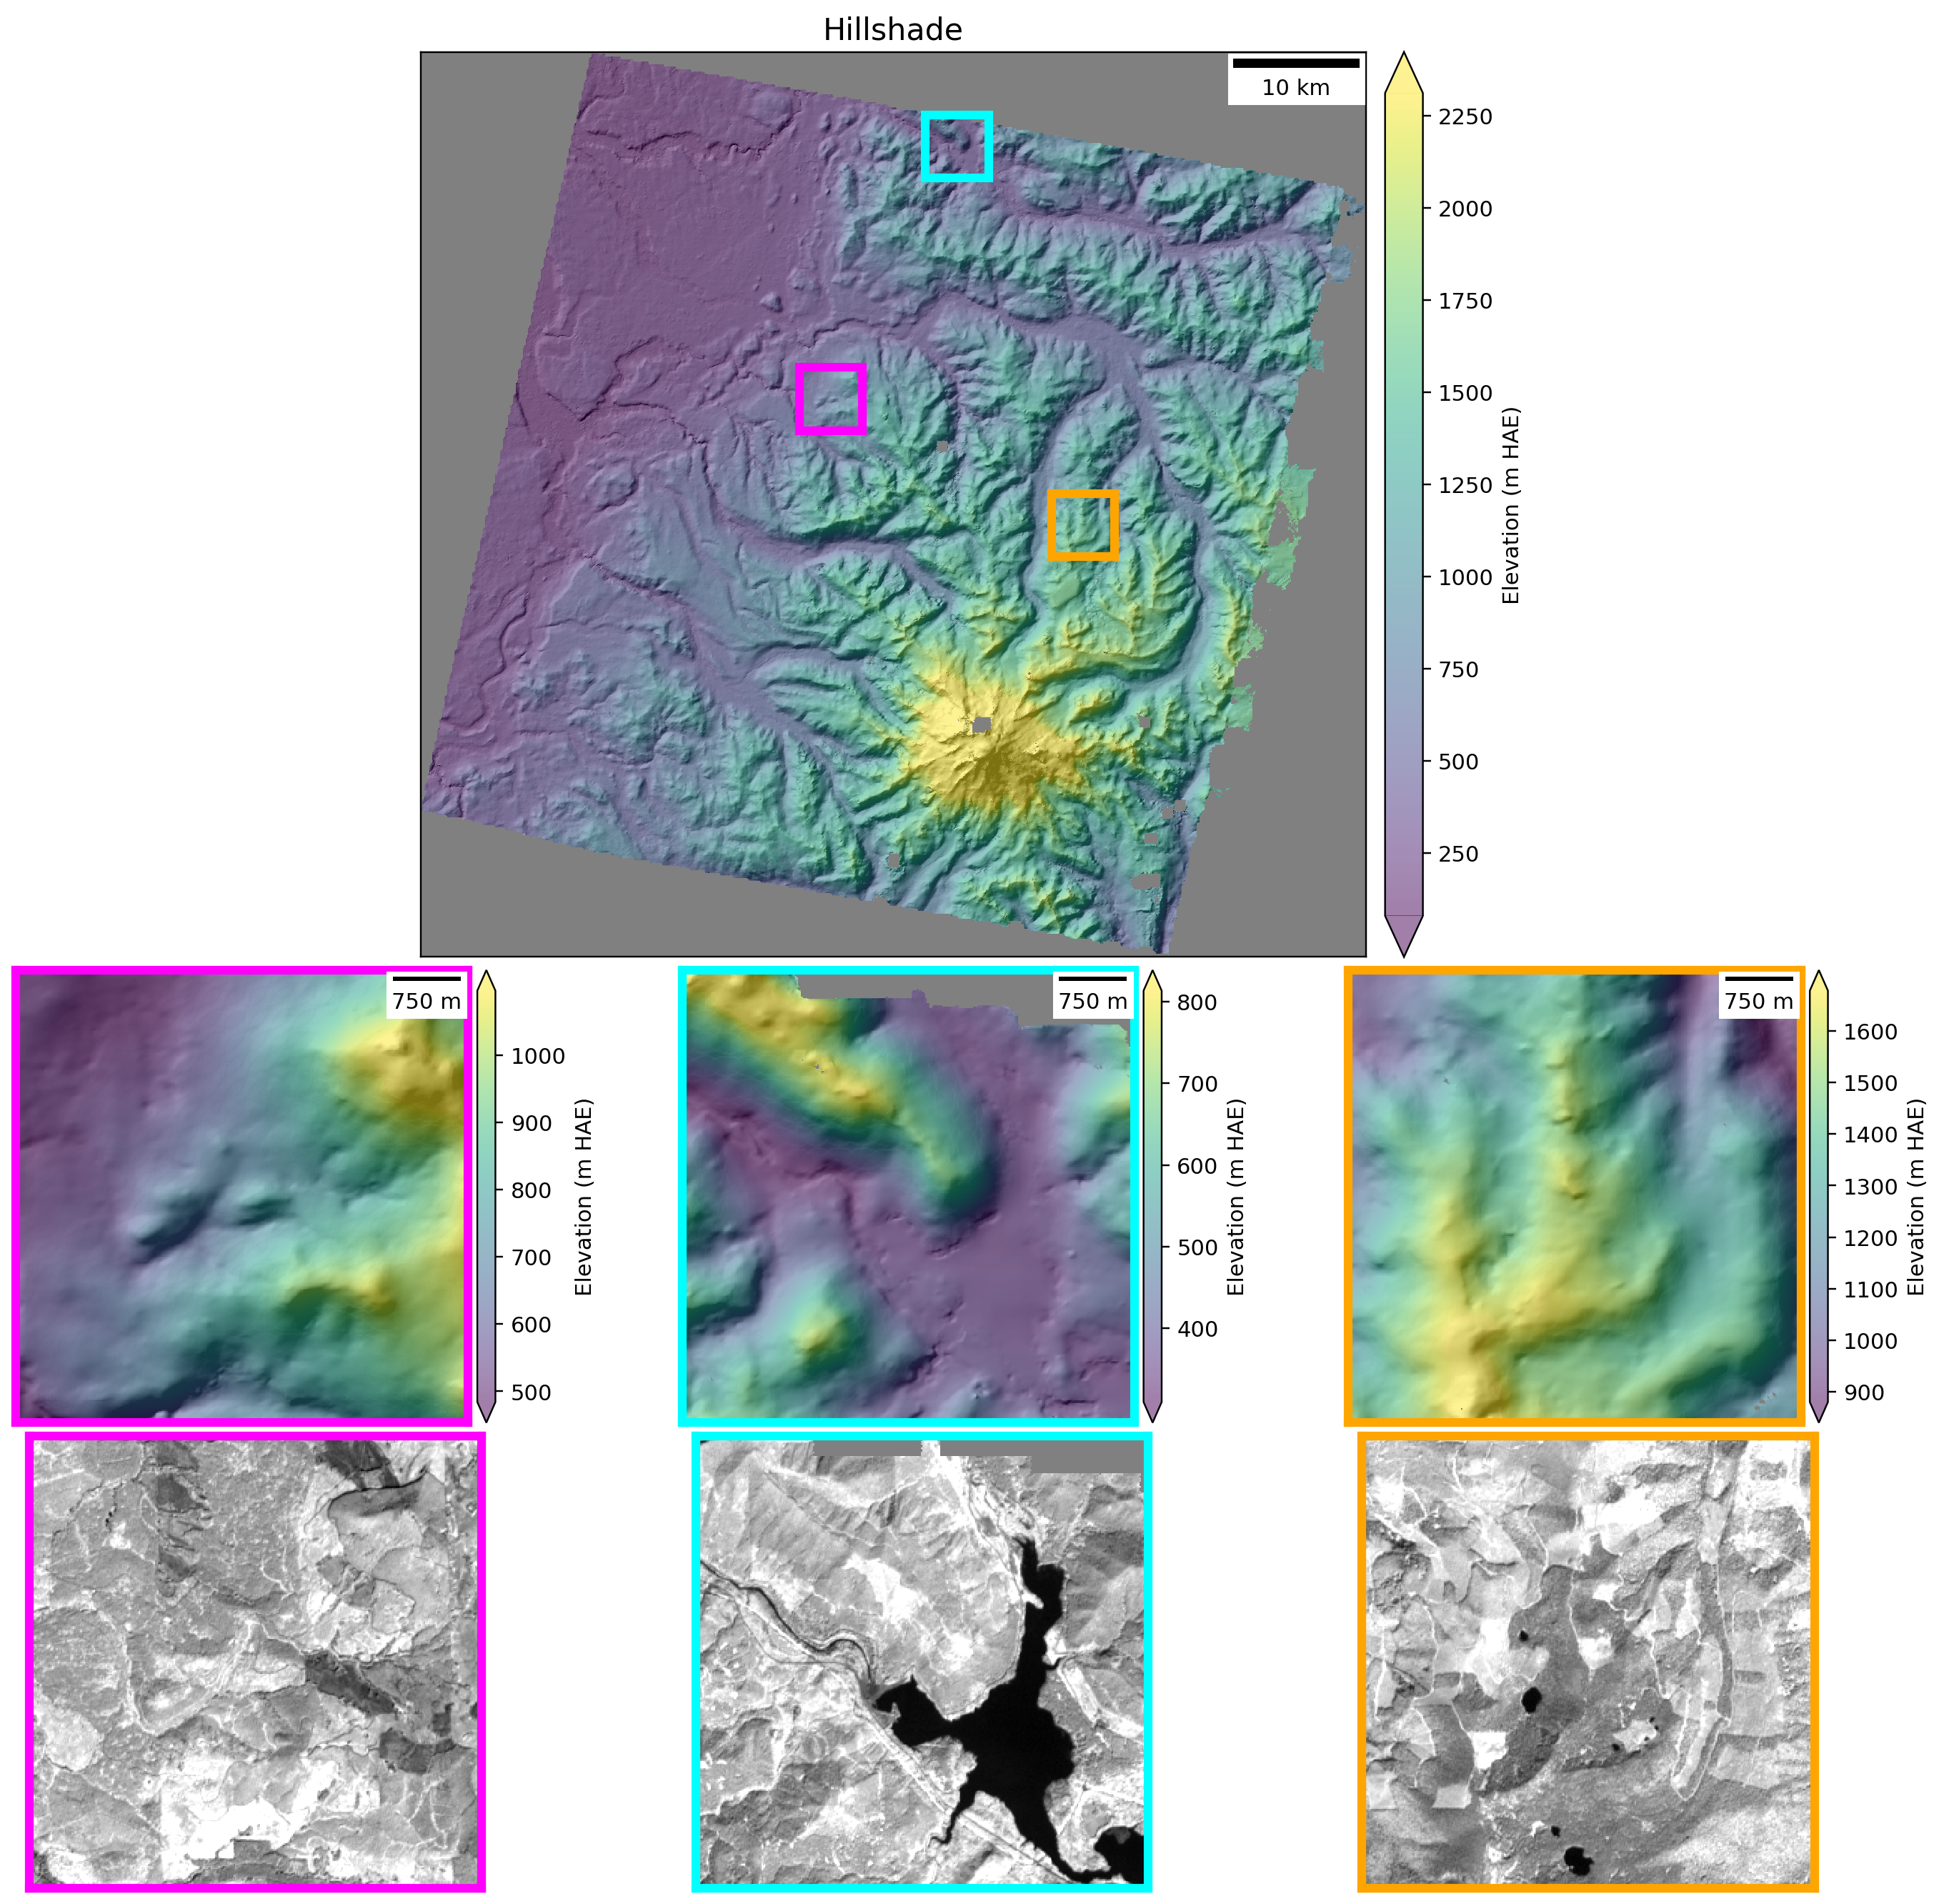
Stereo Plots#
from asp_plot.stereo import StereoPlotter
plotter = StereoPlotter(
  directory,
  stereo_directory,
  reference_dem=reference_dem,
)
WARNING:asp_plot.utils:Could not find ('*-align-L.txt',) in /Users/ben/Desktop/asp-plot-examples/aster/out_stereo_proj/. Some plots may be missing.
WARNING:asp_plot.utils:Could not find ('*-align-R.txt',) in /Users/ben/Desktop/asp-plot-examples/aster/out_stereo_proj/. Some plots may be missing.
Reference DEM: /Users/ben/Desktop/asp-plot-examples/aster/out_stereo/run-200m-DEM.tif


ASP DEM: /Users/ben/Desktop/asp-plot-examples/aster/out_stereo_proj/run-DEM.tif
plotter.title = "Hillshade"

plotter.plot_detailed_hillshade(
  subset_km=5
)
/Users/ben/miniforge3/envs/asp_plot/lib/python3.14/site-packages/osgeo/gdal.py:606: FutureWarning: Neither gdal.UseExceptions() nor gdal.DontUseExceptions() has been explicitly called. In GDAL 4.0, exceptions will be enabled by default.
  warnings.warn(
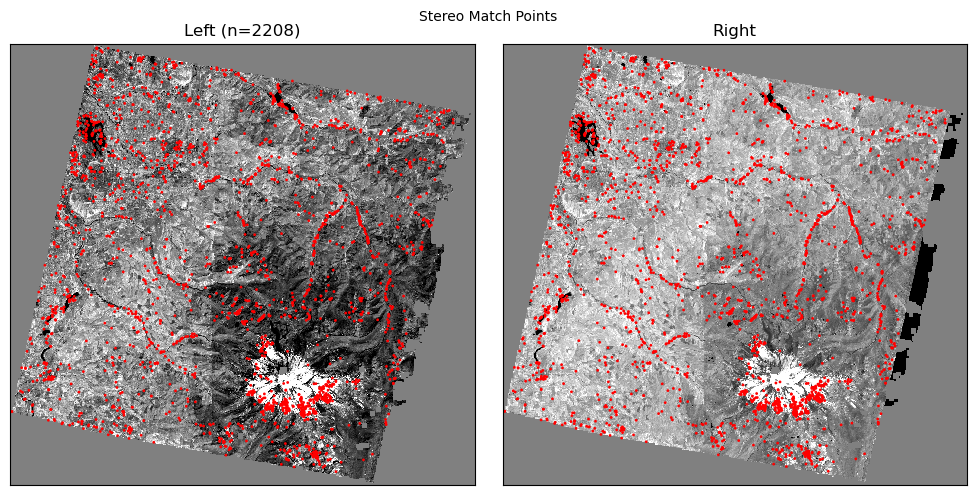
plotter.title="Stereo Match Points"

plotter.plot_match_points()
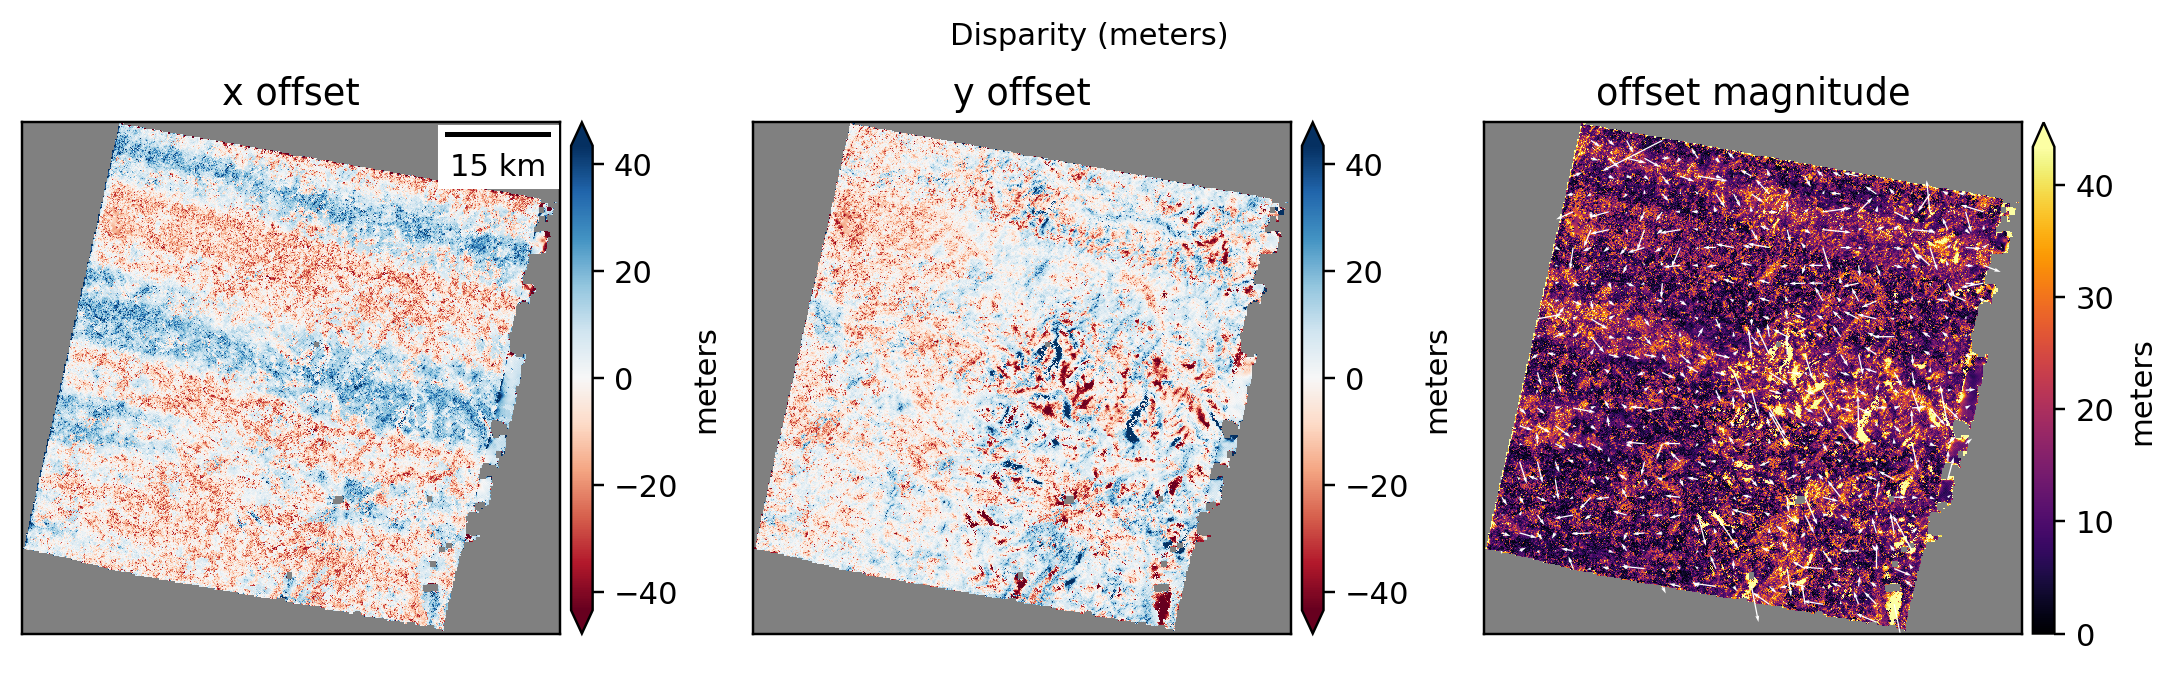
plotter.title = "Disparity (meters)"

plotter.plot_disparity(
  unit="meters",
  quiver=True,
)
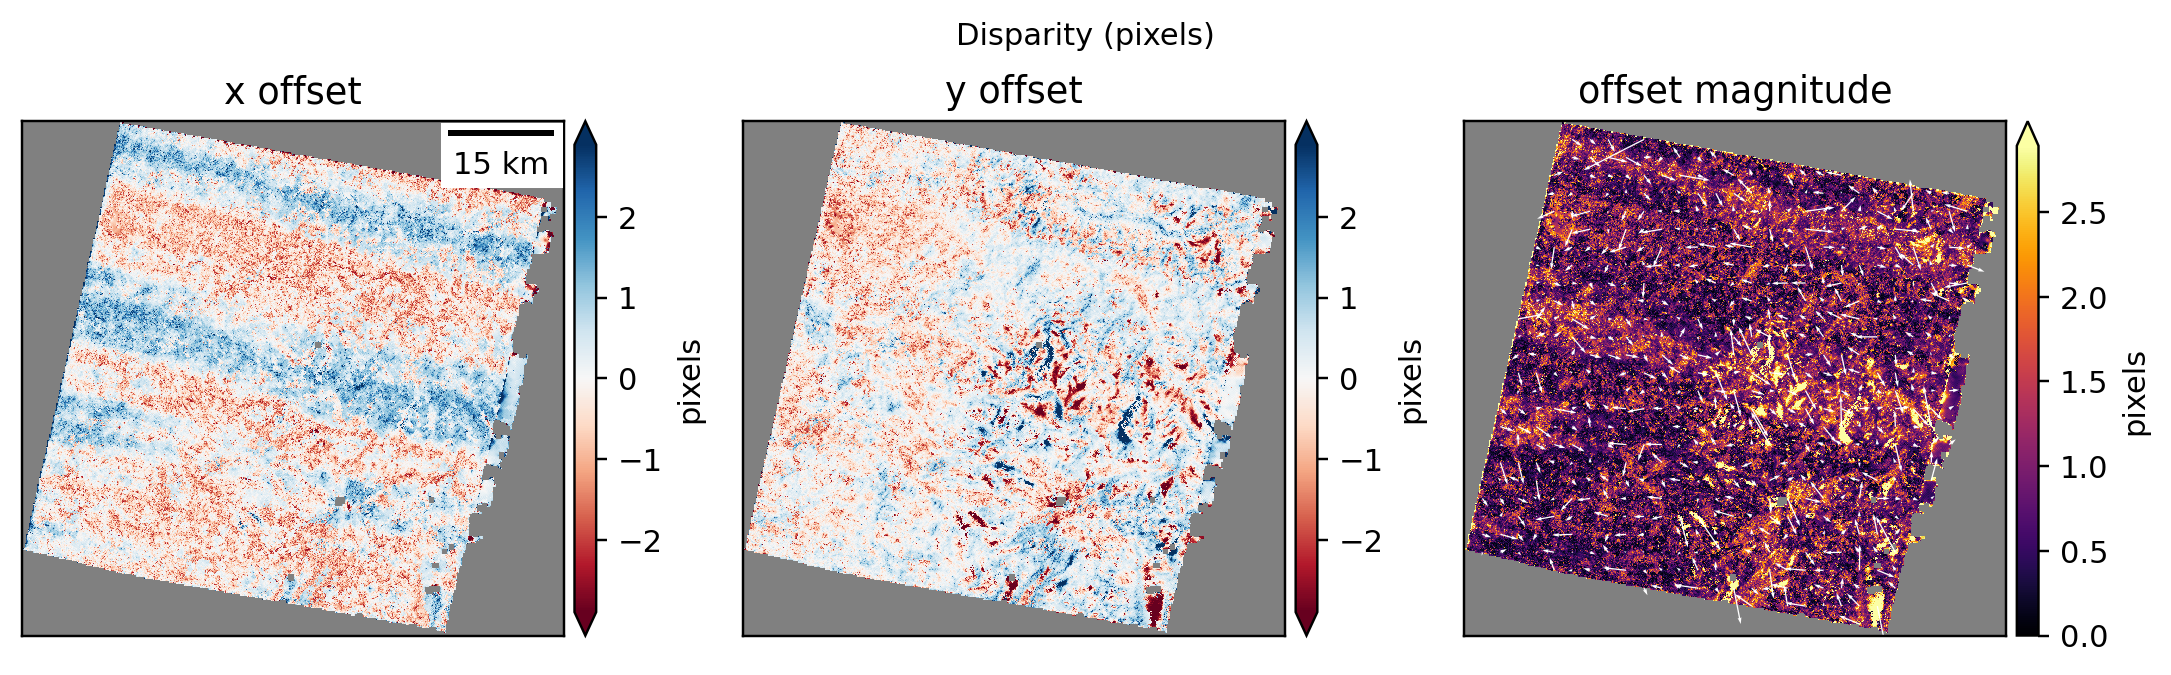
plotter.title = "Disparity (pixels)"

plotter.plot_disparity(
  unit="pixels",
  quiver=True,
)
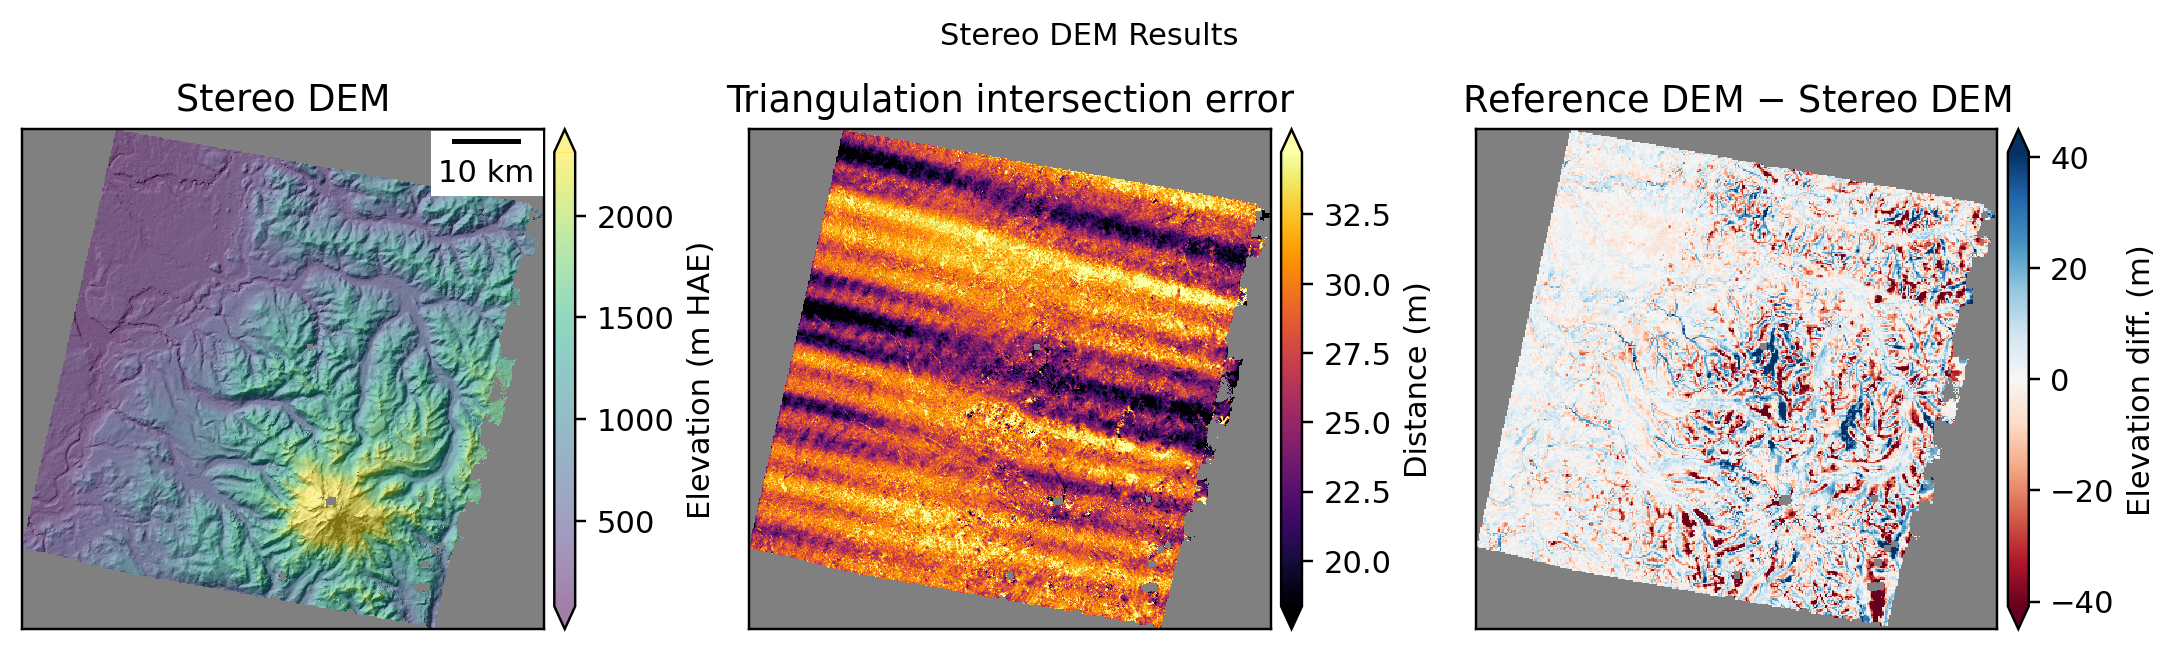
plotter.title = "Stereo DEM Results"

plotter.plot_dem_results()
Plotting DEM results. This can take a minute for large inputs.
WARNING:asp_plot.stereo:

Found a DEM of difference: /Users/ben/Desktop/asp-plot-examples/aster/out_stereo_proj/run-DEM_run-200m-DEM_diff.tif.
Using that for difference map plotting.
ICESat-2 Altimetry Validation#
import contextily as ctx
from asp_plot.altimetry import Altimetry
from asp_plot.utils import Raster
asp_dem = StereoPlotter(
  directory,
  stereo_directory,
).dem_fn

dem_raster = Raster(asp_dem)
epsg_code = dem_raster.get_epsg_code()
map_crs = f"EPSG:{epsg_code}"

ctx_kwargs = {
    "crs": f"EPSG:{epsg_code}",
    "source": ctx.providers.Esri.WorldImagery,
    "attribution_size": 0,
    "alpha": 0.5,
}
WARNING:asp_plot.utils:Could not find ('*-align-L.txt',) in /Users/ben/Desktop/asp-plot-examples/aster/out_stereo_proj/. Some plots may be missing.
WARNING:asp_plot.utils:Could not find ('*-align-R.txt',) in /Users/ben/Desktop/asp-plot-examples/aster/out_stereo_proj/. Some plots may be missing.
Reference DEM: /Users/ben/Desktop/asp-plot-examples/aster/out_stereo/run-200m-DEM.tif


ASP DEM: /Users/ben/Desktop/asp-plot-examples/aster/out_stereo_proj/run-DEM.tif
icesat = Altimetry(
  directory=directory,
  dem_fn=asp_dem
)
icesat.request_atl06sr_multi_processing(
    processing_levels=["all"],
    save_to_parquet=True,
)

# Time range and buffering options:

# icesat.request_atl06sr_multi_processing(
#     processing_levels=["all"],
#     save_to_parquet=True,
#     time_range="buffered",
#     scene_date="2020-02-18"
# )
Time filter: 2018-10-14T00:00:00Z to 2026-04-14T00:00:00Z (all available)

ICESat-2 ATL06 request processing for: all
{'poly': [{'lon': -122.34846522847539, 'lat': 46.699595216327424}, {'lon': -122.34846522847539, 'lat': 47.353178047956256}, {'lon': -121.3512354148296, 'lat': 47.353178047956256}, {'lon': -121.3512354148296, 'lat': 46.699595216327424}, {'lon': -122.34846522847539, 'lat': 46.699595216327424}], 't0': '2018-10-14T00:00:00Z', 't1': '2026-04-14T00:00:00Z', 'res': 20, 'len': 40, 'ats': 20, 'fit': {'maxi': 6}, 'cnf': 'atl03_high', 'srt': -1, 'cnt': 10}
Existing file found, reading in: /Users/ben/Desktop/asp-plot-examples/aster/atl06sr_all.parquet
Filtering ATL06-SR all
icesat.filter_esa_worldcover(filter_out="water")
No temporal filtering needed for the simplified report workflow. Advanced temporal filtering is still available via notebook/script method calls.
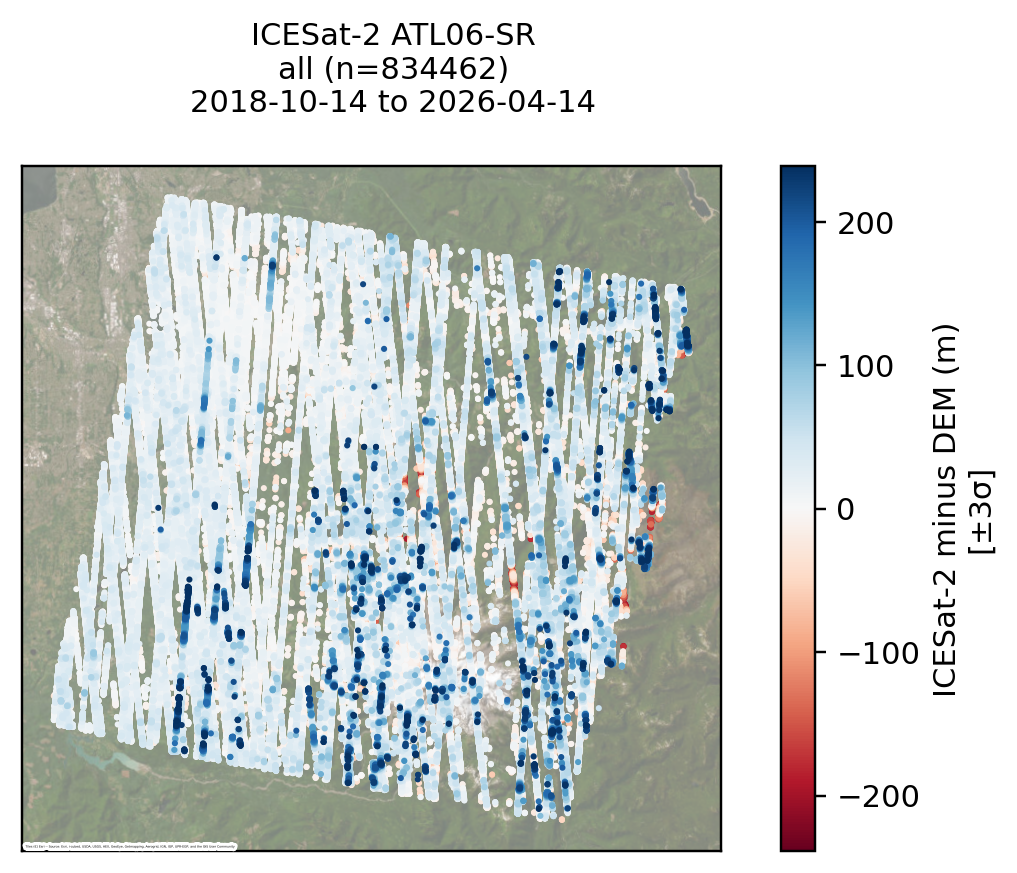
# Map view
icesat.mapview_plot_atl06sr_to_dem(
key="all",
map_crs=map_crs,
**ctx_kwargs,
)
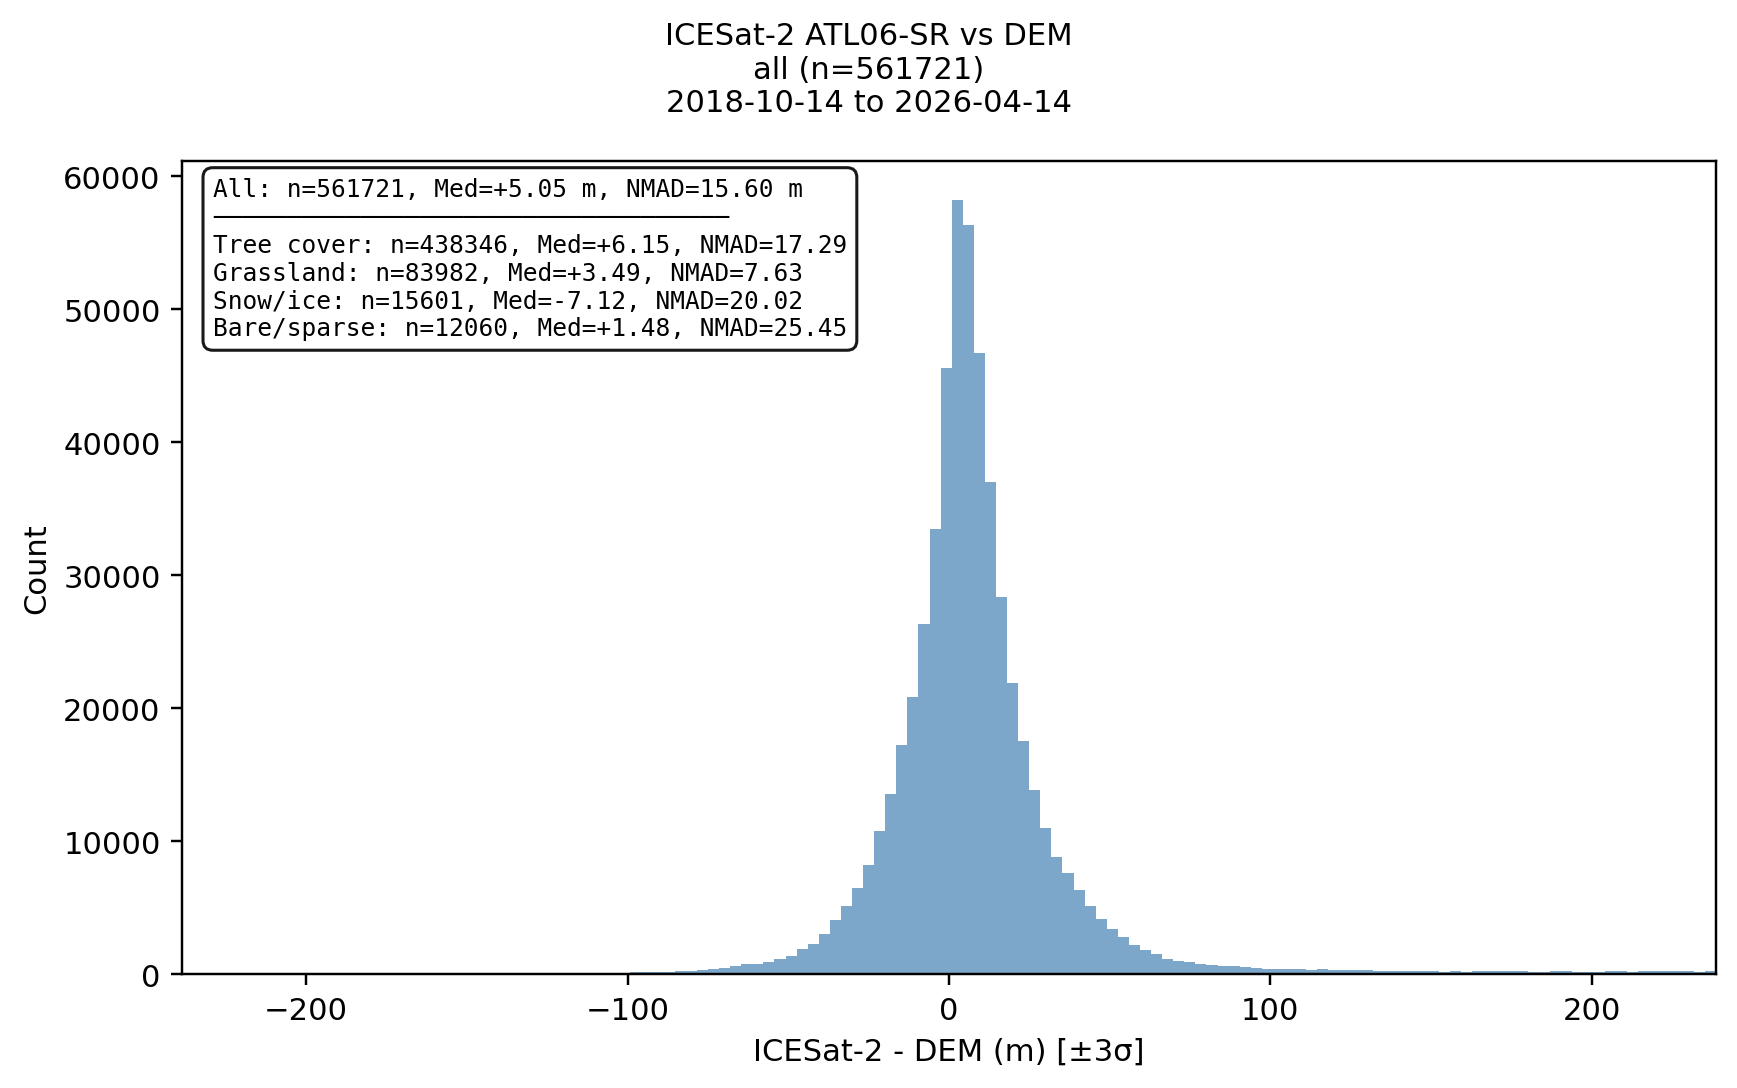
# Histogram with per-landcover-class statistics
icesat.histogram_by_landcover(key="all")
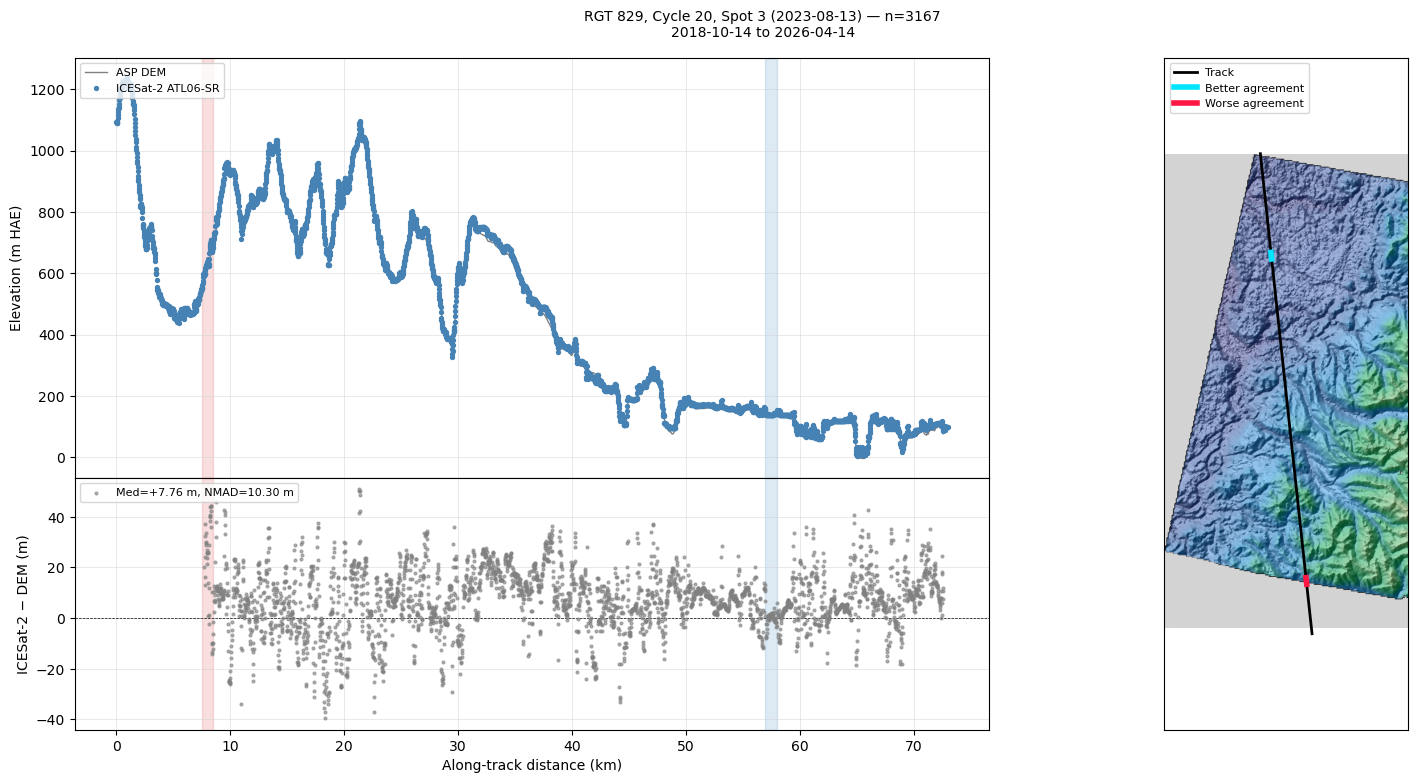
# Profile along the best ICESat-2 track
icesat.plot_atl06sr_dem_profile(key="all")
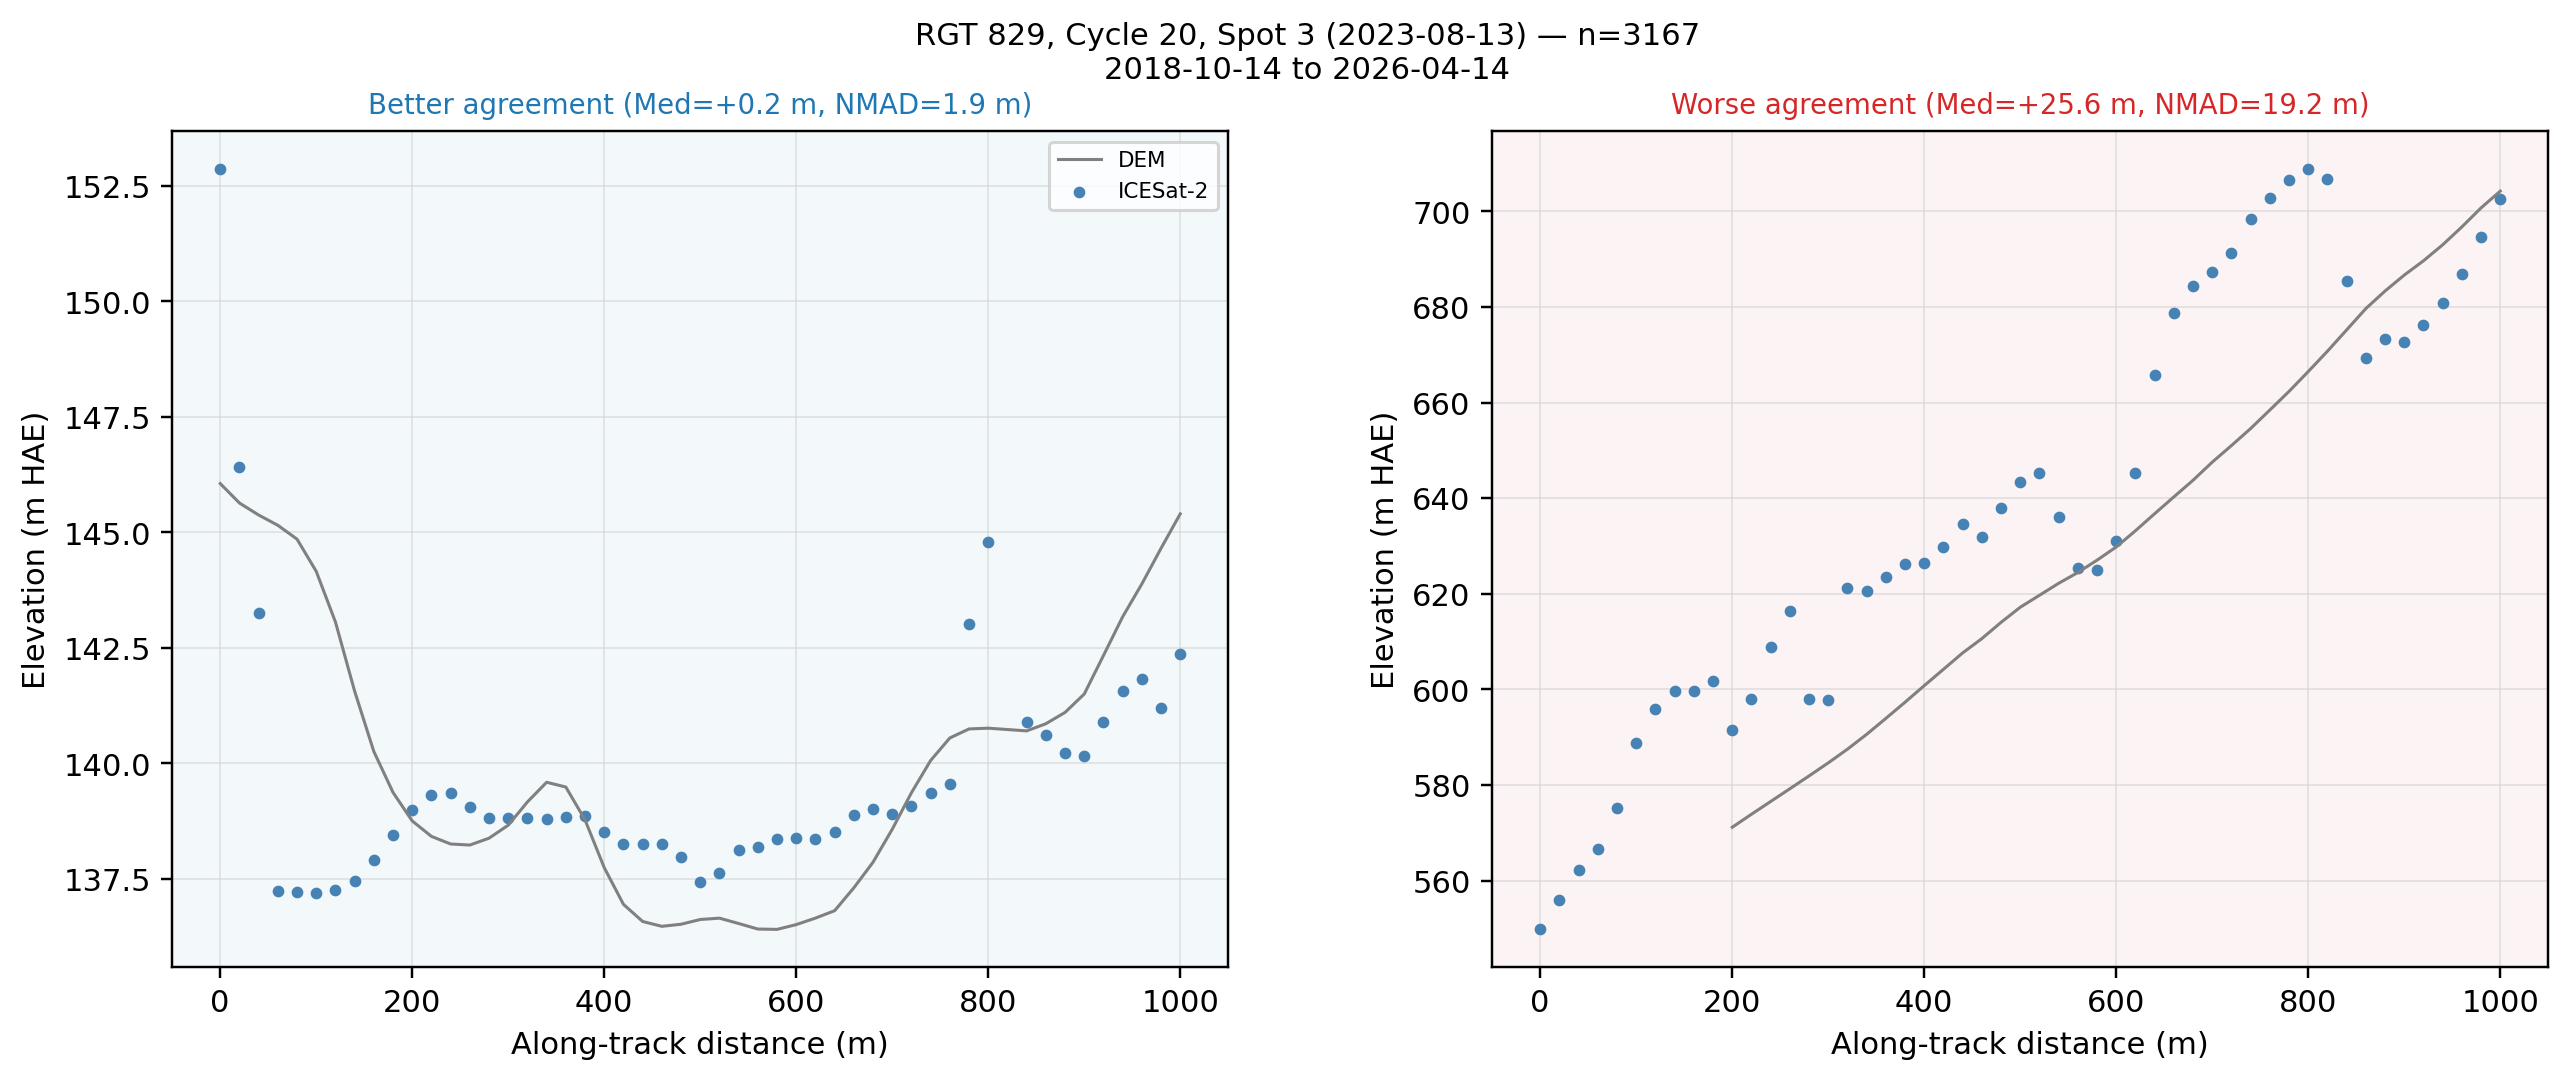
icesat.plot_best_worst_segments(key="all")
icesat_minus_dem not found in ATL06 dataframe: all. Running differencing first.

  Outlier filter (3σ): all 851411 → 834462 (removed 16949)