Example plotting following ASP Docs Section 8.2 for Mars Reconnaissance Orbiter (MRO) HiRISE camera#
Below are example asp_plot outputs following the processing in ASP Docs Mars HiRISE example Section 8.2.
Retrieve .IMG files:
wget -r -l1 -np \
     "http://hirise-pds.lpl.arizona.edu/PDS/EDR/PSP/ORB_001500_001599/PSP_001513_1655/" \
     -A "*RED*IMG"

wget -r -l1 -np \
     "http://hirise-pds.lpl.arizona.edu/PDS/EDR/PSP/ORB_001700_001799/PSP_001777_1650/" \
     -A "*RED*IMG"
Install ISIS and pre-process the images for stereo:
ISIS> hiedr2mosaic.py PSP_001777_1650_RED*.IMG
ISIS> hiedr2mosaic.py PSP_001513_1655_RED*.IMG
ISIS> cam2map4stereo.py PSP_001777_1650_RED.mos_hijitreged.norm.cub \
                        PSP_001513_1655_RED.mos_hijitreged.norm.cub
Run stereo processing and point2dem:
parallel_stereo PSP_001513_1655_RED.map.cub \
                PSP_001777_1650_RED.map.cub \
                result/output

point2dem -r mars --stereographic \
          --auto-proj-center      \
          --errorimage \
          result/output-PC.tif
DISCLAIMER#
The output from this processing is particularly large and difficult to work with. The asp_plot commands currently struggle with full HiRISE DEMs.
Here is screenshot of the DEM and hillshade output by the commands above using the ASP tool stereo_gui to display them:
stereo_gui result/output-DEM.tif
Full report#
Example command for full stereo-processing report
directory = "~/Desktop/asp-plot-examples/mars_hirise/"
stereo_directory = "result/"
!asp_plot \
  --directory $directory \
  --stereo_directory $stereo_directory \
  --add_basemap False \
  --plot_icesat False \
  --plot_geometry False
Full report with MOLA altimetry#
To include MOLA altimetry comparison plots in the report, first request the data using request_planetary_altimetry (see the MOLA Altimetry Comparison section below for details), then pass the downloaded CSV via --altimetry_csv:
mola_csv = f"{directory}/../mars_hirise/438124_mola/MolaPEDR_-15N-14N_175E176E_20260319T205252258_topo_csv.csv"

!asp_plot \
  --directory $directory \
  --stereo_directory $stereo_directory \
  --add_basemap False \
  --plot_altimetry True \
  --altimetry_csv $mola_csv \
  --plot_geometry False
Individual plots#
Example modular usage of asp_plot for this example processing.
Processing Parameters#
%load_ext autoreload
%autoreload 2

from asp_plot.processing_parameters import ProcessingParameters
processing_parameters = ProcessingParameters(
    processing_directory=directory,
    stereo_directory=stereo_directory
)
processing_parameters_dict = processing_parameters.from_log_files()

print(f"Processed on: {processing_parameters_dict['processing_timestamp']}\n")

print(f"Reference DEM: {processing_parameters_dict['reference_dem']}\n")

print(f"Bundle adjustment ({processing_parameters_dict['bundle_adjust_run_time']}):\n")
print(processing_parameters_dict["bundle_adjust"])

print(f"\nStereo ({processing_parameters_dict['stereo_run_time']}):\n")
print(processing_parameters_dict["stereo"])

print(f"\nPoint2dem ({processing_parameters_dict['point2dem_run_time']}):\n")
print(processing_parameters_dict["point2dem"])
Processed on: 2025-11-04 15:47:19

Reference DEM:

Bundle adjustment (N/A):

Bundle adjustment not run

Stereo (1 hours and 2 minutes):

stereo --corr-seed-mode 1 --compute-point-cloud-center-only --threads 20 PSP_001513_1655_RED.map.cub PSP_001777_1650_RED.map.cub result/output

Point2dem (1 hours and 49 minutes):

point2dem -r mars --stereographic --auto-proj-center --errorimage result/output-PC.tif result/output-PC.tif
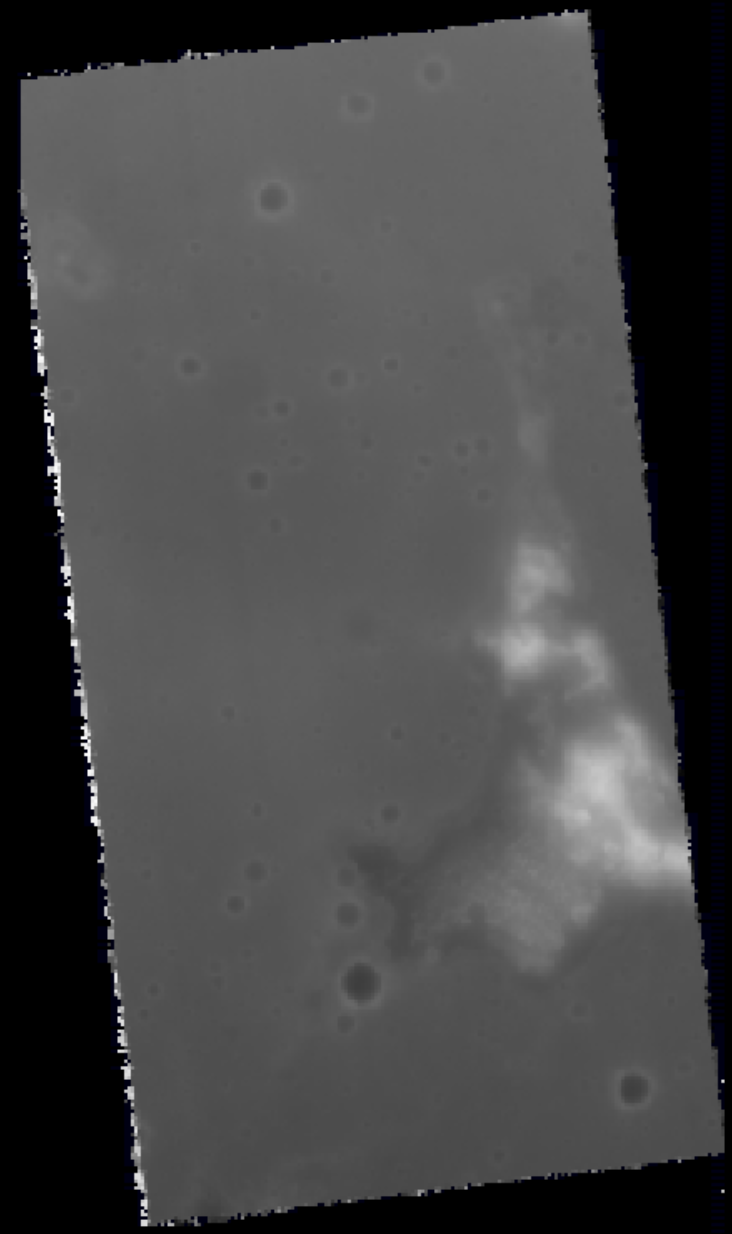
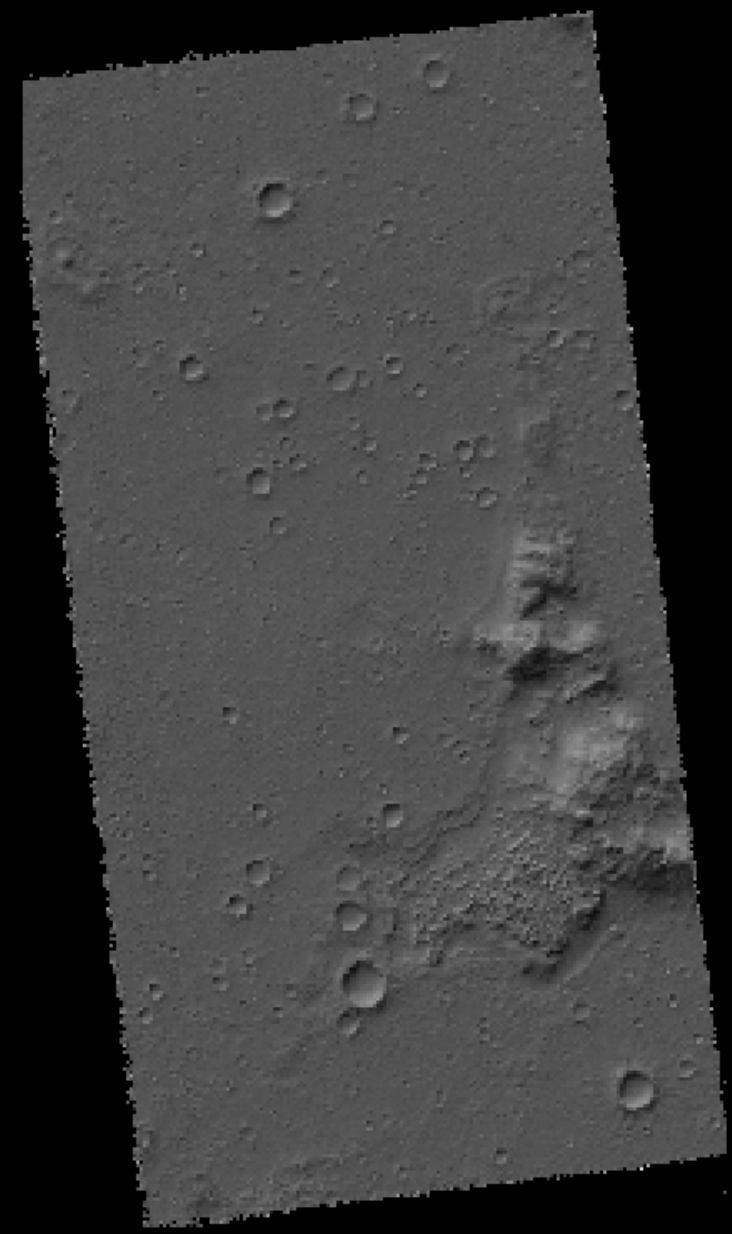
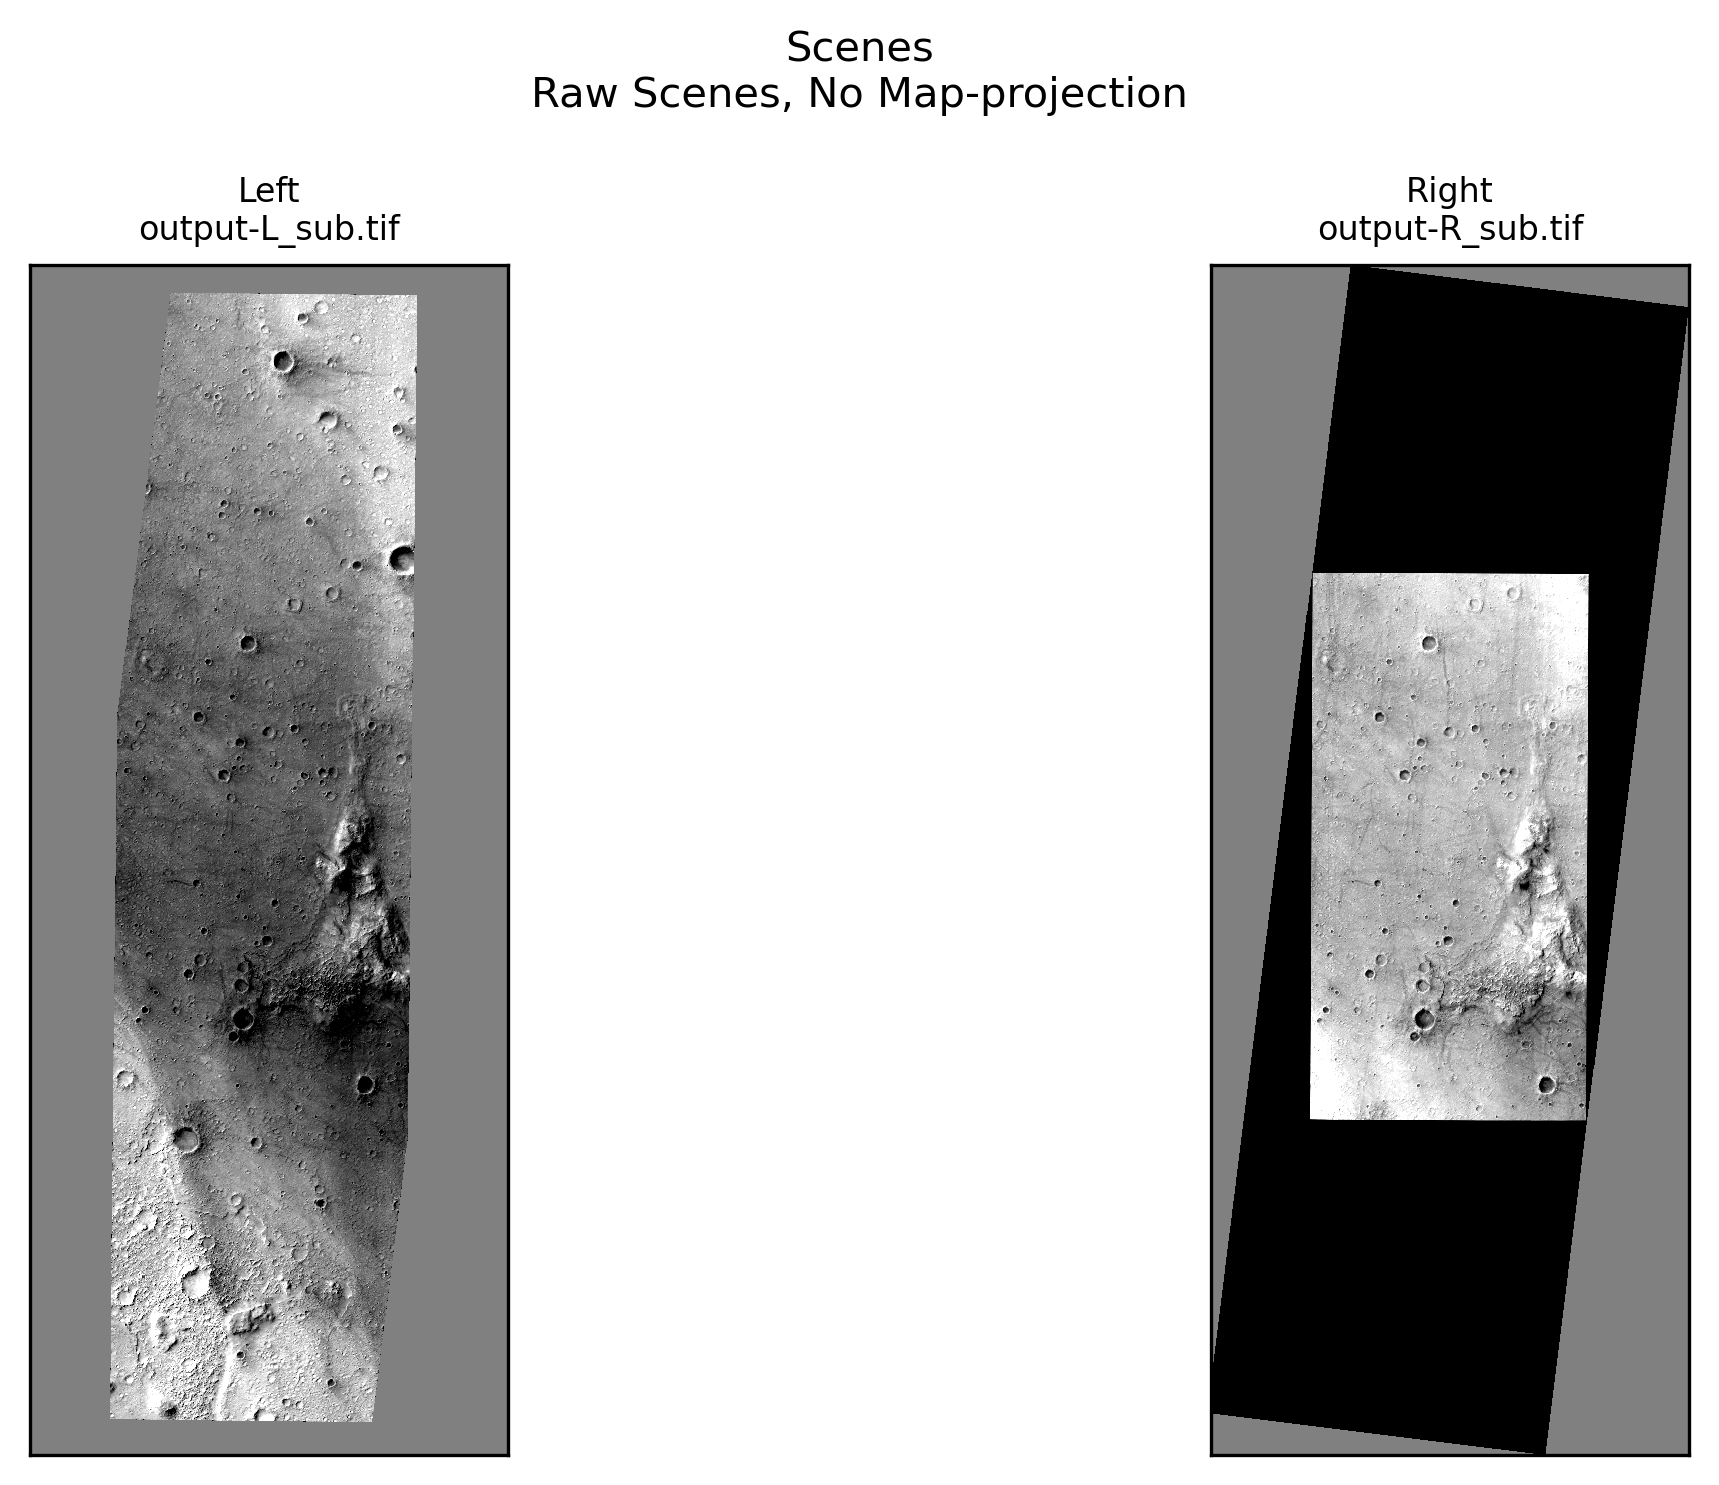
Scene Plots#
from asp_plot.scenes import ScenePlotter
plotter = ScenePlotter(
  directory,
  stereo_directory,
  title="Scenes"
)

plotter.plot_scenes()
Stereo Plots#
from asp_plot.stereo import StereoPlotter
plotter = StereoPlotter(
  directory,
  stereo_directory
)
WARNING:asp_plot.stereo:

No reference DEM found in log files. Please supply the reference DEM you used during stereo processing (or another reference DEM) if you would like to see some difference maps.
ASP DEM: ~/Desktop/asp-plot-examples/docs_sect_8_2_mars_hirise_SEE_PFE/result/output-DEM.tif
plotter.title = "Hillshade"

plotter.plot_detailed_hillshade()
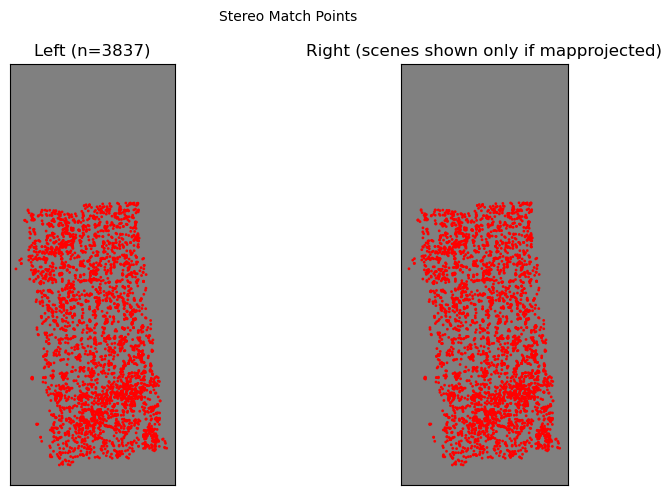
plotter.title="Stereo Match Points"

plotter.plot_match_points()
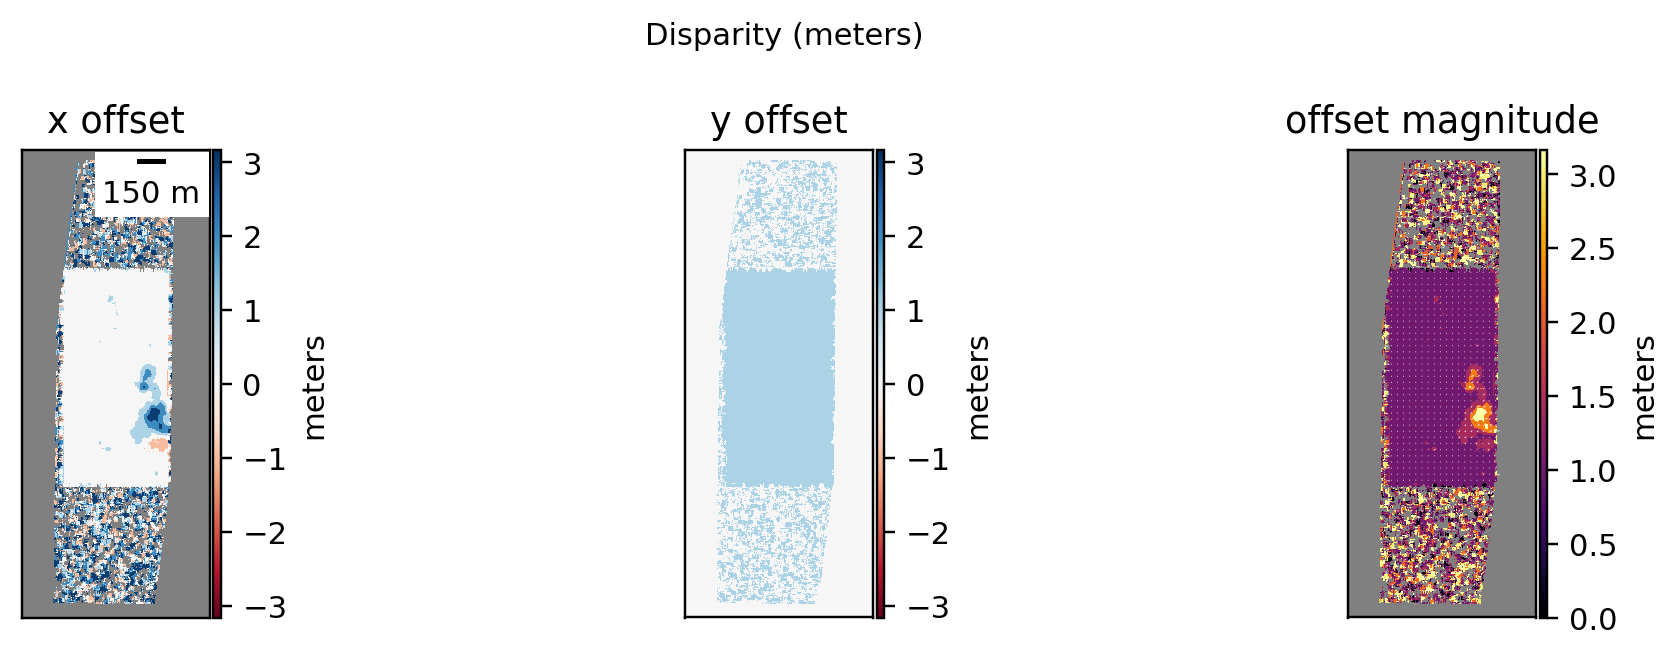
plotter.title = "Disparity (meters)"

plotter.plot_disparity(
  unit="meters",
  quiver=True,
)
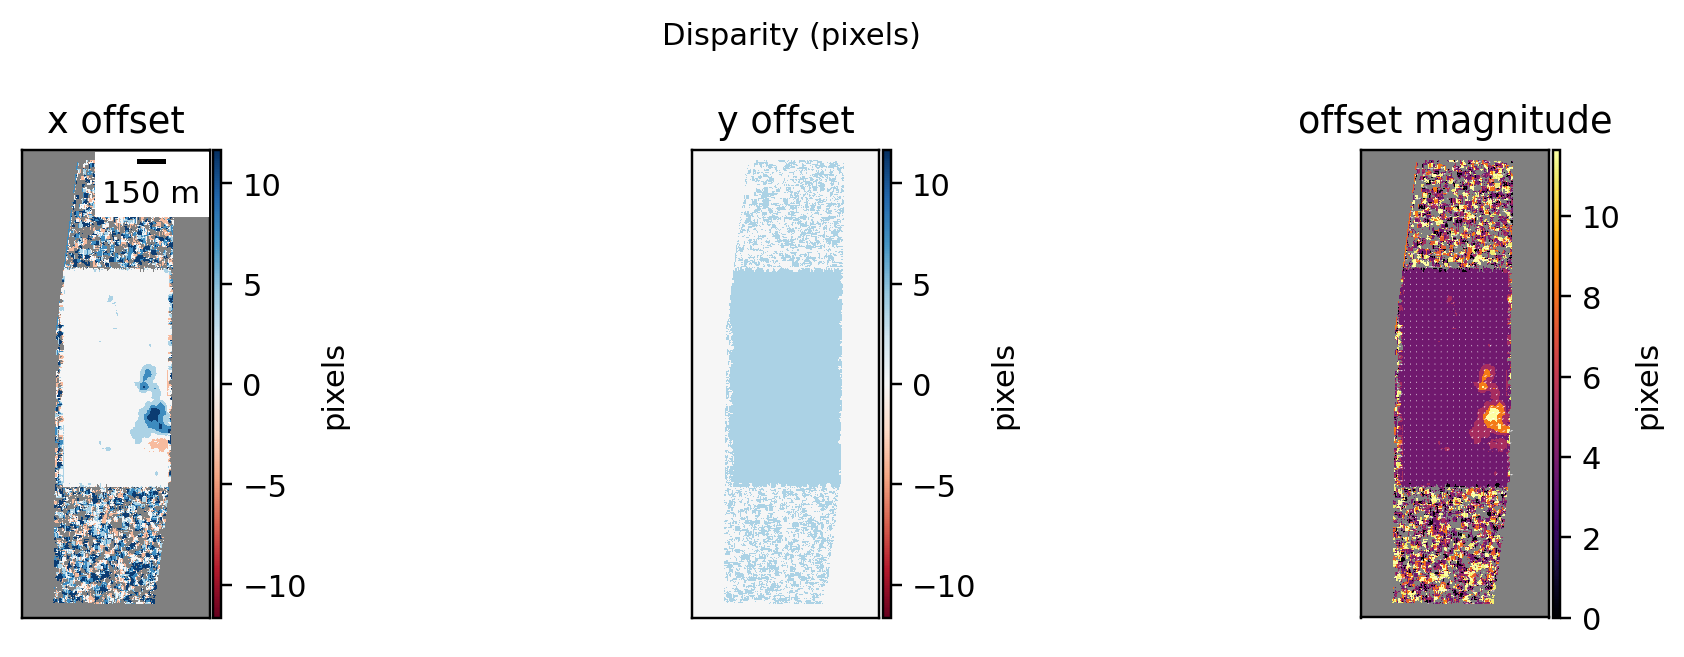
plotter.title = "Disparity (pixels)"

plotter.plot_disparity(
  unit="pixels",
  quiver=True,
)
plotter.title = "Stereo DEM Results"

plotter.plot_dem_results()
Plotting DEM results. This can take a minute for large inputs.
/Users/ben/miniforge3/envs/asp_plot/lib/python3.13/site-packages/osgeo/gdal.py:311: FutureWarning: Neither gdal.UseExceptions() nor gdal.DontUseExceptions() has been explicitly called. In GDAL 4.0, exceptions will be enabled by default.
  warnings.warn(
WARNING:asp_plot.utils:Could not find ('*DEM*diff.tif',) in ~/Desktop/asp-plot-examples/docs_sect_8_2_mars_hirise_SEE_PFE/result/. Some plots may be missing.
The Kernel crashed while executing code in the current cell or a previous cell.

Please review the code in the cell(s) to identify a possible cause of the failure.

Click <a href='https://aka.ms/vscodeJupyterKernelCrash'>here</a> for more info.

View Jupyter <a href='command:jupyter.viewOutput'>log</a> for further details.
MOLA Altimetry Comparison#
Compare the ASP DEM against Mars Orbiter Laser Altimeter (MOLA) altimetry data from the ODE Granular Data System (GDS).
Step 1: Request MOLA data#
Use the request_planetary_altimetry CLI tool to submit a query. The tool auto-detects that this is a Mars DEM and submits a MOLA PEDR request:
request_planetary_altimetry \
  --dem result/output-DEM.tif \
  --email user@example.com
This saves an altimetry_request_info.yml alongside the DEM with the job metadata. You will receive an email when the data is ready.
Step 2: Download and unzip#
Download the .zip from the link in the email and unzip it. The key file is *_topo_csv.csv.
Step 3: Load and compare#
Pass the CSV to the Altimetry class (or use asp_plot --altimetry_csv for the full report):
from asp_plot.altimetry import Altimetry

dem_fn = f"{directory}/{stereo_directory}/output-DEM.tif"
mola_csv = f"{directory}/../mars_hirise/438124_mola/MolaPEDR_-15N-14N_175E176E_20260319T205252258_topo_csv.csv"

alt = Altimetry(directory=directory, dem_fn=dem_fn)
alt.load_planetary_csv(mola_csv)
alt.planetary_to_dem_dh()
alt.planetary_points[["lon", "lat", "height", "dem_height", "altimetry_minus_dem"]].head(10)
alt.mapview_plot_planetary_to_dem()
alt.histogram_planetary_to_dem()